Analytics Secrets For Your Business
Internet users collectively produce 2 quintillion bytes of data daily. A slim percentage of that data comes to your platform and describes the ways consumers interact with your content, ads, and products. You need to be able to assess that information to make your business more profitable.
Analytics consulting helps you break down that data into manageable categories. You can use consulting tools to collect that data in an accessible interface and then capitalize on it in future platform updates.
If you want to increase the ROI of your platform, dive into the data that’s available to you. (If you don’t, you’re missing a valuable resource.)
Find the Right Analytics Consulting Tool
While Google Analytics isn’t the only tool to track your platform’s analytics, it’s one of the most popular and easiest to use. Other tools include:
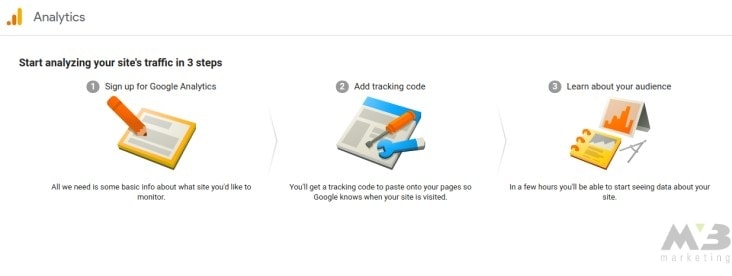
To create a property through Google Analytics, you need to:
- 1. Sign in to Google Analytics using your Gmail account.
- 2. Click “Admin.”
- 3. Find the “Account” column and choose the Gmail account you want affiliated with your platform.
- 4. Find the “Property” column.
- 5. Select “+Create Property.”
- 6. Choose between using a website or a mobile app.
- 7. If you choose to track a mobile app, select “Firebase” under the “Tracking Method” column. Once you’ve selected your chosen app, click “Connect App.”
- 8. If you choose to connect a website to your Analytics, enter your website’s name.
- 9. Enter your URL.
- 10. Select an industry category.
- 11. Select a reporting time.
- 12. Receive your tracking ID.
What Are Your Key Analytics?
You’ll need to use a platform such as Google Analytics or the others mentioned here to track the four key metrics behind your site:
- Audience Data
- Acquisition Data
- Behavior Data
- Conversion Data
Analytics Secrets 1: Do You Know Your Audience?
If you want to assess your business’ success, you first need an audience. As consumers flock to your platform, you’ll discover who’s most interested in your product. You can subsequently craft new content and products with that specific audience in mind.
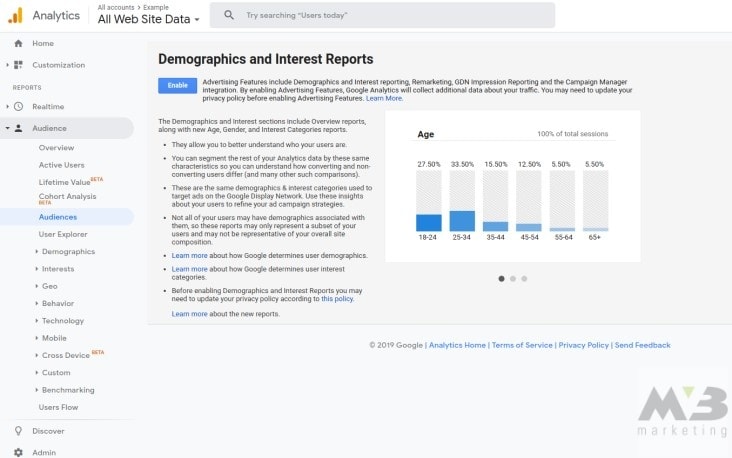
Break Down Your Audience Data
Break your audience analytics down into the following categories:
- Demographics: This segment will identify the age and gender of your consumers.
- Interests: You can better segment your audience once you know where their interests lie.
- Location: Determine whether SEO localization is for your platform based upon the primary locations of your consumer audience.
- Behavior: Behavior tracking allows you to assess whether a consumer is new to your platform or returning. You’ll also be able to determine the frequency of their appearance on your platform and the ways in which they engage with it.
- Technology: You’ll be able to tell which browsers, operating systems, and networks your consumers use to look at your platform in the “technology” category of your chosen analysis tool.
- Mobile: Is your platform mobile compatible? See how many consumers are coming to your site from their cell phones.
- Benchmarking: Compare your metrics to those of your competitors while also developing a better understanding of how your audience comes to your platform.
- User Flow: Follow the path that your consumers take while on your platform to discover what, if any, major thoroughfares exist on your platform.
Analytics Secrets 2: Check Your Bounce Rates
To track audience interaction with your platform, you also need to assess your site’s bounce rate. You find your platform’s bounce rate in your Google Analytics overview report. The bounce rate that Analytics displays will reflect your site-wide bounce rate as opposed to the bounce rates for your individual pages.
Google Analytics determines your overall site bounce rate by averaging all the user visits that have resulted in an immediate click-away. Then, Analytics divides that number by the number of visits that your platform has received either in a set period or since its inception.
When checking your platform’s benchmarking, make sure to assess your bounce rate compared to your industry’s average. You can do so as follows:
- 1. Click “Account Settings” under your Google Analytics admin section.
- 2. Find the checkmark next to “benchmarking” and click it.
From here, you’ll be able to compare industry averages by utilizing the “Site Content” tab. Then, find and click on “landing pages.” Google Analytics will display site-wide bounce rates here. If you want to get more specific in your assessment of industry bounce rates, you can use the “advanced filter feature” or “content drill-down” feature.
Analytics Secrets 3: What’s Another Name for “Where You Find Your Audience” Data? Acquisition Data.
Audience data describes the kind of people your platform attracts. Acquisition data describes where those people are coming from. When you track acquisitions, you develop a better understanding of the backlink networks that build up your site.
Assess the Paths Leading to Your Site
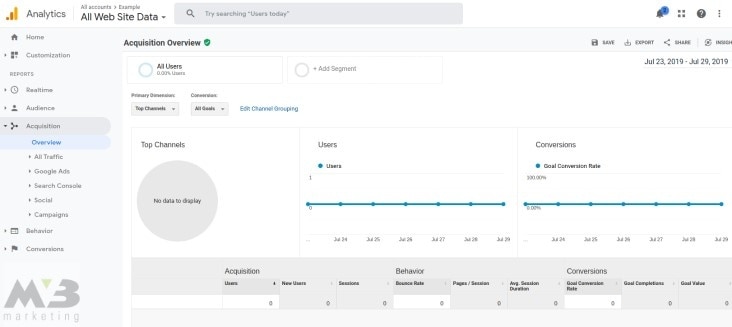
Use the Acquisitions category of your tool of choice to assess the following data points:
- AdWords: If you’ve paid for advertising, then the AdWords category will let you know how well those campaigns are doing and what kind of traffic they’re attracting.
- Search Engine Popularity: While Google reigns over 90 percent of search engine market share, your platform still shows up in other search engines’ indexes. Use this category to learn how well you’re pulling traffic from Bing, DuckDuckGo, and other engines.
- Social Media Traffic: Learn what social media platforms (Instagram, Twitter, Facebook, YouTube, and so on) pull the greatest percentage of your audience. This analytic lets you not only assess how well your content has performed on these platforms, but you can also see whether you’ve been endorsed by other sources and how that endorsement has impacted your traffic.
- Campaign Success: If you’ve built campaigns through your platform, you need to determine their ROI. This section enables you to assess the cost differentiation between your paid keywords and organic keywords alongside those individual elements’ traffic success.
How Do Users Interact with Your Site?
When you assess behavior on your platform, you track not only the way consumers behave while on your platform but also how they interact with your site’s architecture.
Analytics Secrets 4: Start with the Site Basics
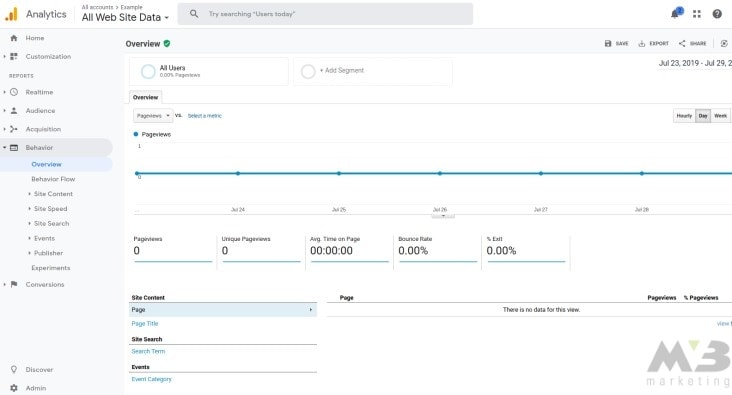
To get a better understanding of behavioral data as offered through the analytical tool of your choice, break down the category into the following segments:
- Site Content: The site content section of this category lets you know how many of your platform’s content pages are viewed daily, weekly, and monthly.
- Site Search: Site search helps you find the keywords that your consumers use to find your platform. This category teaches you to better integrate question-based keywords into your content and to boost individual page’s SERP rankings.
- Events: The term “events” describes the way in which a person interacts with the content you share online. If someone downloads something from your platform, logs in to the account through your site, or puts an item in the cart, this category will let you know.
Analytics Secrets 5: Assess Your Site’s Speed
You can check the speed of your site through numerous mediums. Google offers a PageSpeed Insights toolkit that can help you understand why your website is slow to load.
When using PageSpeed Insight, input your site’s URL and let the algorithm within spit out your site’s speed rating.
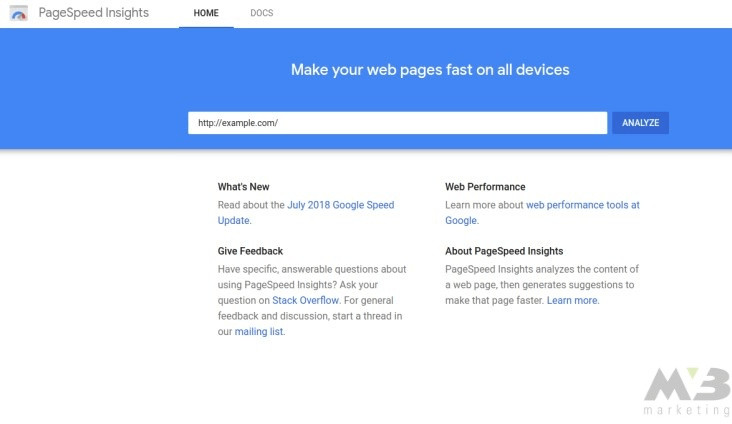
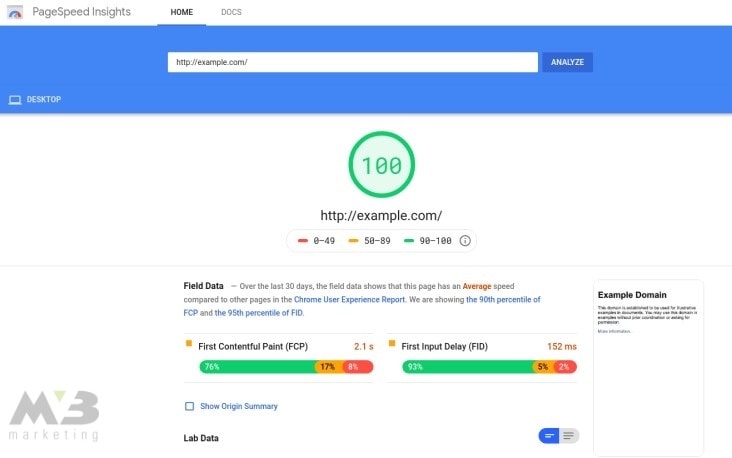
Note that you want your site to hit 80 at a minimum. Scores of 80 and above indicate that your platform will load within 2 seconds, preventing consumer bounces. Lower scores indicate that your site requires more time to load and that you’re more likely to lose your audience.
PageSpeed will outline the elements of your site that are slowing your load speed in red below your score, so you can fix them.
One of the easiest ways to speed up your site’s download time is to compress your images and HTTP. The metadata included in these elements isn’t necessary to make them appear on your platform, so getting rid of it will optimize your site’s functionality.
WordPress offers WP Smush along with other plugins, which, upon their integration into your platform, will compress your images for you.
Analytics Secrets 6: Run An A/B Test
An A/B test allows you to compare different versions of your platform for their functionality. As such, you can run an A/B test to see whether consumers would interact more effectively on a different version of your platform.
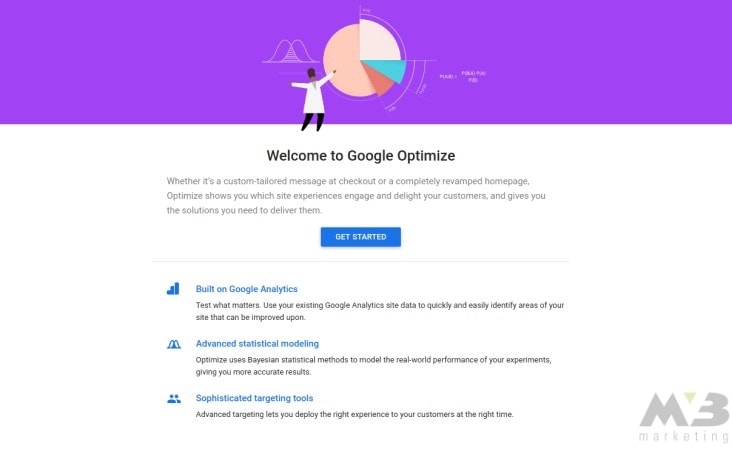
You can use a number of different tools to run one of these tests. Google offers Google Optimize. You can create a Google Optimize account through your Analytics account:
- 1. Log in to Google Analytics.
- 2. Click “Behavior.”
- 3. Click “Experiments.”
- 4. Click “learn more” to navigate to Google Optimize.
Alternatively, traveling to the Google Optimize home page allows you to sign up for the tool-free of charge. Click “Create Account” and provide your personal information to get started.
From here, you’ll need to create a container for your platform. Click the button on Optimize’s interface and use your platform’s URL to indicate which site you want to diversify.
With a container completed, you can link your existing platform to Google Optimize. Do this by clicking the “link property” tag in the interface’s drop-down menu. Select your property of choice, and you’ll be good to go.
Now, create an experiment for your platform:
- 1. Click the “Create Experiment” button.
- 2. Enter the URL of the page you want to duplicate and test.
- 3. Choose your preferred test: A/B test, multivariate test, or a redirect test.
- 4. Click “create a variant.”
Note: An A/B test allows you to change one element of your chosen page. Multivariate testing enables you to change multiple elements of a page. Redirect testing compares two separate pages’ data against one another to determine which is more functional.
Once you’ve created your variant, you can start to play with your duplicated page. Simply click “edit element,” and you’ll be able to modify your page’s architecture.
As soon as you’re satisfied with your modifications, your new page needs to collect data. Move to the “Reporting” tab in the Optimize interface to assess this data via the platform’s Summary Card.
Analytics Secrets 7: The Juicy Parts (You Call Them Conversions)
Finally, you’ll need to determine how your content contributes to the transaction success of your business. By setting a goal and ensuring that your URLs can be tracked by tools such as Google Analytics, you’ll be able to identify what forms of content and engagement most frequently result in conversions.
How to Break Down Your Conversion Data

You can break your conversion data down into the following categories to make it easier to understand:
- Goals: You set your goals in this section to let your tool of choice know what specific data trends to look for. Once your goal has been met, your tool will add a conversion to your data. Use this section to measure how many times you’ve completed your goal and the flow of that growth.
- E-commerce: E-commerce tracking helps you stay on top of the products that users most frequently purchase from your platform. You can use this data to assess the performance of your products throughout your industry, sales, and purchase time.
- Multi-channel Funnels: Multi-channel funnel data lets you assess the customer journey to your product and its eventual purchase. This channel will tell you where a buying consumer came from, what keywords were used to find your product, what ads were interacted with, and so on.
- Attribution: Attribution breaks down the multi-channel funnel further. When a consumer eventually makes a purchase, attribution will let you know which medium finally convinced that individual to buy your product.
Rather Have Someone Do it For You? Hello, We’re MV3 Marketing.
Do you want help working with an analytical tool of your choosing? Therefore our team at MV3 makes it so much easier for you to assess your audience, acquisitions, behavior, and conversions—in little to no time at all. Reach out today to get started.
Conclusion
Is your company in need of help? MV3
Marketing Agency has numerous Marketing experts ready to
assist you. Contact MV3 Marketing to
jump-start your business.


