Why a metrics list is not the same as a metrics process
Search for saas metrics and you get long lists defining MRR, churn, LTV, and a dozen other terms. We checked the structural pattern of the top five ranking pages for this exact phrase and found that two of five use any data table, and only two of five cite a first-party finding of their own rather than a generic industry claim.

Source: seo_competitor_pages table (DataForSEO), pulled 2026-10-26, n=5 pages
A list of definitions does not tell a reader which metric to check first, second, and third. This guide orders four metrics into a monthly sequence, with a worked example at each step, so the numbers below are either defined with their formula or sourced to where they came from.
Before you start
| Item | Why it matters |
|---|---|
| Your billing system’s current MRR and the prior month’s MRR | Needed to calculate net revenue retention in Step 1 |
| A rough cost-per-acquisition figure and an estimate of average customer lifetime | Needed for the LTV to CAC ratio in Step 2 |
| Your trailing 12-month revenue growth rate and operating margin | Needed for the Rule of 40 in Step 3 |
| 30 minutes once a month | This is a monthly review process, not a daily dashboard check |
Step 1: Start with MRR and net revenue retention, not total revenue
Total revenue hides whether existing customers are expanding, holding steady, or shrinking. Net revenue retention, or NRR, answers that by comparing this month’s recurring revenue from last month’s customer base against last month’s figure, including upgrades, downgrades, and cancellations, but excluding brand new customers.
An NRR above 100 percent means existing customers are growing faster than they are churning or downgrading, which is a healthier growth signal than new-logo revenue alone, since it is harder to manufacture temporarily with a sales push.
Expected result: one MRR number and one NRR percentage, calculated the same way every month.
Common mistake: counting new customers inside the NRR calculation, which inflates the number and hides a retention problem.
Step 2: Check the LTV to CAC ratio next
Divide customer lifetime value by customer acquisition cost. A commonly cited healthy range in SaaS is a ratio around 3 to 1 or higher, meaning each customer returns roughly three times what it cost to acquire them over their lifetime. A ratio near 1 to 1 means you are roughly breaking even on acquisition alone, before accounting for servicing costs.
This ratio only makes sense after Step 1, because a rising CAC paired with falling NRR compounds into a much worse growth problem than either number shows on its own.
Expected result: one LTV to CAC ratio, checked against the prior month’s ratio, not just its absolute value.
Common mistake: calculating LTV from an optimistic average lifetime rather than from actual historical retention data, which overstates the ratio.
| Metric | Value |
|---|---|
| Monthly US search volume | 480 |
| Competition level | Low |
| CPC | USD 19.79 |
| Median word count, top 5 ranking pages | 4,225 words |
| Ranking pages using a data table | 2 of 5 |
| Ranking pages citing a first-party data point | 2 of 5 |
Source: seo_keywords and seo_competitor_pages tables (DataForSEO), pulled 2026-10-26, n=5 ranking pages for “saas metrics”

Source: seo_competitor_pages table (DataForSEO SERP data), pulled 2026-10-26, n=5 pages.
Step 3: Calculate the Rule of 40
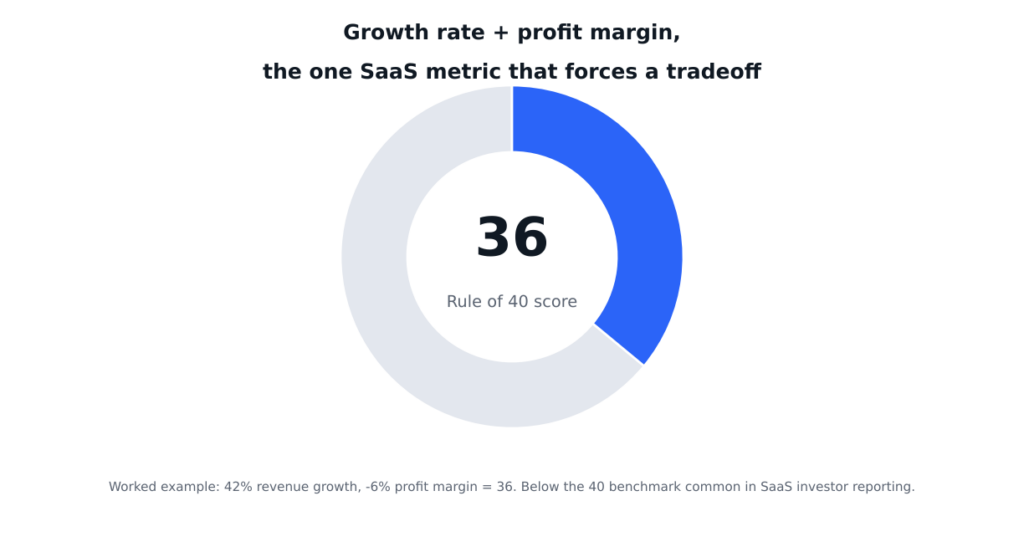
Add your revenue growth rate to your profit margin. SaaS investors have commonly used 40 as a rough benchmark: a company growing fast enough and burning efficiently enough to clear that combined score is generally considered to be making a reasonable tradeoff between growth and profitability.
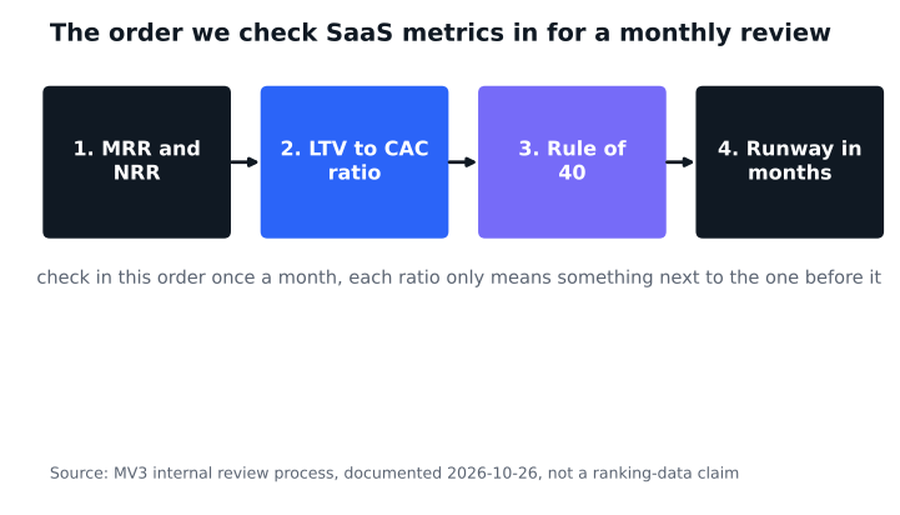
MV3’s own internal review process, documented 2026-10-26
In the worked example from the quick answer above, 42 percent growth plus a negative 6 percent margin lands at a Rule of 40 score of 36, four points under the common benchmark. That is a real calculation, not a claim about any specific company’s actual performance; treat the 40 threshold as a rough industry convention rather than a hard pass or fail line.
Expected result: one Rule of 40 score, calculated from your own growth rate and margin for the trailing 12 months.
Common mistake: using a single quarter’s growth rate, which swings more than a trailing 12-month figure and makes the score noisy month to month.
Step 4: Finish with runway in months
Divide current cash on hand by your average monthly net burn. This is the metric that turns the first three into a decision: a strong Rule of 40 score with six months of runway still means a near-term funding or spending decision, while the same score with 24 months of runway means you can be patient.
Expected result: one runway figure in months, reviewed in the same monthly sitting as the first three metrics, not separately.
Common mistake: treating runway as a finance-team-only number instead of the figure that tells marketing and sales how much time they have to improve the other three.
Troubleshooting
| Symptom | Likely cause | What to check first |
|---|---|---|
| NRR looks healthy but growth still feels slow | New-logo acquisition has stalled | Check the LTV to CAC ratio and new-customer count separately from NRR |
| Rule of 40 score dropped sharply in one month | A single quarter’s growth rate was used instead of trailing 12 months | Recalculate using a trailing 12-month growth rate |
| LTV to CAC ratio looks too good to be true | Lifetime value was estimated from an optimistic assumption, not historical retention | Rebuild LTV from actual cohort retention data, not an average assumption |
| Leadership disagrees on whether the numbers are good | No one agreed on the order to review them in | Walk through Steps 1 to 4 in order in the same meeting |
Checklist recap
| Step | Done when |
|---|---|
| 1. MRR and NRR | Both numbers are calculated the same way as last month, excluding new logos from NRR |
| 2. LTV to CAC ratio | LTV is built from real cohort data, not an optimistic assumption |
| 3. Rule of 40 | Growth rate and margin use trailing 12 months, not one quarter |
| 4. Runway in months | Reviewed in the same sitting as the first three metrics |
Where MV3 fits in
We help B2B SaaS marketing and growth teams tie campaign and channel reporting into the retention and acquisition-cost side of this process, including the kind of acquisition-cost tracking described in customer acquisition cost for B2B SaaS. If your team already has a tracking dashboard in place and wants to confirm it surfaces the right four numbers in the right order, our guide on a B2B marketing analytics dashboard covers what to track operationally; this guide is the monthly review process that sits on top of it. We do not prepare financial statements or investor reporting; this is a marketing-side read of growth health, not an accounting deliverable. If you want help wiring your own numbers into this sequence, book a call with us.
| Metric | Formula |
|---|---|
| Net revenue retention | (Starting MRR plus expansion minus downgrades minus churn) divided by starting MRR, new logos excluded |
| LTV to CAC ratio | Customer lifetime value divided by customer acquisition cost |
| Rule of 40 | Revenue growth rate plus profit margin |
| Runway in months | Cash on hand divided by average monthly net burn |
FAQ
What counts as a good Rule of 40 score for an early-stage SaaS company?
40 is a commonly cited industry convention, not a strict pass or fail line. A company well under 40 is not automatically unhealthy if growth is still early and intentional, but the score is worth tracking over time rather than checking once.
How is net revenue retention different from gross retention?
Gross retention only measures how much recurring revenue you keep, treating any downgrade or cancellation as a loss with no offset. Net revenue retention adds back expansion revenue from upgrades, so it can exceed 100 percent while gross retention cannot.
How often should these four metrics be reviewed?
Monthly, in the same sitting and in the same order every time, so the numbers are comparable month over month rather than calculated differently depending on who is doing the math.
Share this article

Vance Moore is Chief Growth Officer at MV3 Marketing and leads its team of SEO professionals, engineers and auditors.
Ready to audit your organic growth opportunity?
$2,500 flat. 5 business days. Six deliverables tied to pipeline , not rankings. No retainer required.
Get the Organic Growth Audit →