What is customer acquisition cost in B2B SaaS?
Customer acquisition cost is what it costs you to win one new paying customer. The arithmetic is simple. As David Skok of Matrix Partners writes, “it’s relatively easy at the top level to add up all the marketing and sales expense in a period and divide it by the total number of customers (to get CAC)” (forEntrepreneurs, SaaS Metrics 2.0).
The hard part is not the division. It is deciding what goes into the top number, which period the customers belong to, and how to split both by channel. We sell SEO and analytics services to B2B SaaS companies, so we have a commercial interest in you measuring this well. This guide shows the method, a worked example with every sum shown, and what our own data looked like when we tried it.
What should go into the spend number?
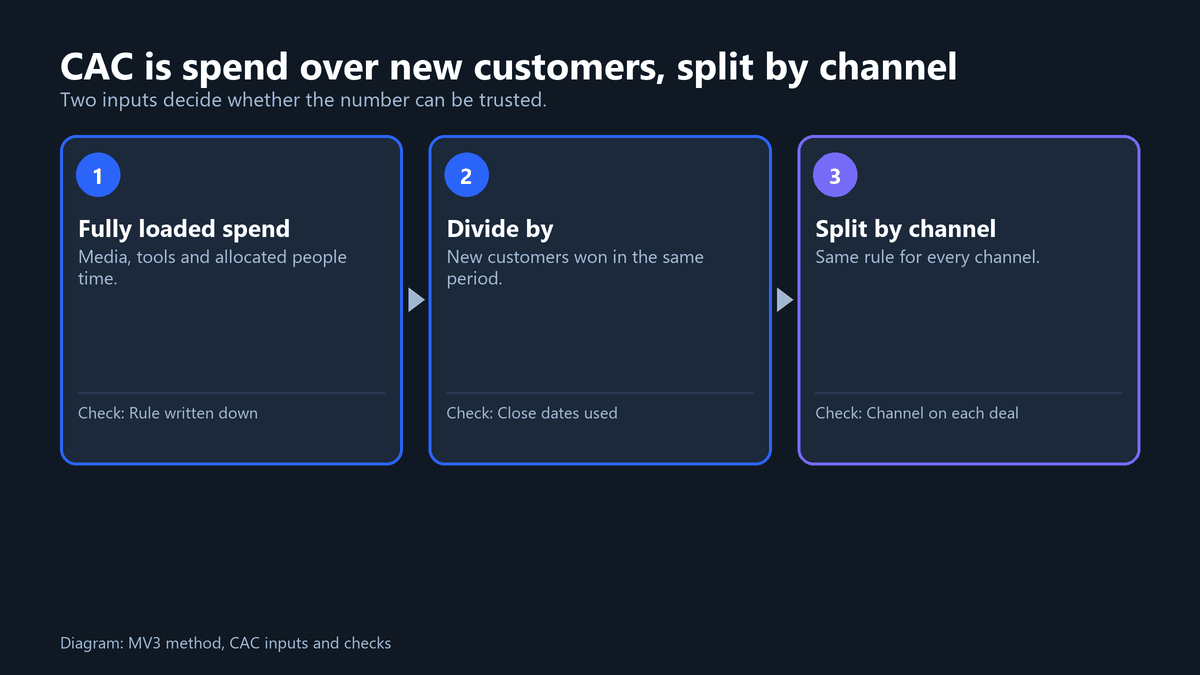
Use a fully loaded figure. That means media spend, software and tools, and the salary and commission time of the people who produce the customers. A media-only figure is easier to pull from an ad platform, but it flatters every channel that needs people to work, such as outbound and content.
| Cost type | Include? | Example |
|---|---|---|
| Media spend | Yes | Paid search budget, sponsorships |
| Tools tied to acquisition | Yes | Sales engagement tool, SEO tool seats |
| People time on acquisition | Yes, allocated | SDR salary, content writer, ad manager share |
| Commissions and referral fees | Yes | Partner payouts on closed deals |
| Customer success after the sale | No | Onboarding, renewals, support |
Skok flags the allocation problem directly: “once you try to segment down your spend you run into questions like ‘how much marketing expense do I allocate to a given segment’, ‘how much of the sales expense’?” Pick a rule, write it down and keep it fixed. A consistent rule beats a perfect one that changes every quarter.
How do you calculate CAC by channel step by step?
A blended CAC tells you the average. A channel CAC tells you where to put the next unit of budget. Here is the sequence we use.
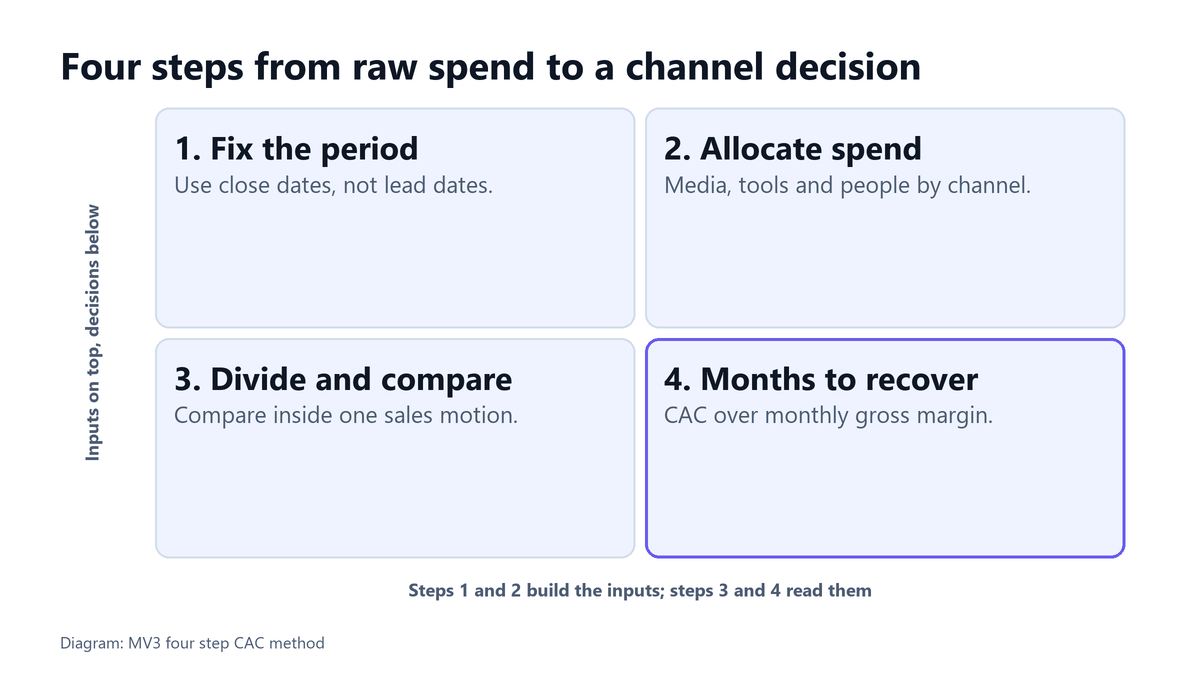
Step 1: Fix the period and use close dates
Choose a quarter. Count customers by the date they paid or signed, not by the date the lead was created. A lead created in September that closes in December belongs to the December customer count.
Expected result: one list of customers with a close date and a channel. Common mistake: counting leads, which makes every ratio look better than the cash.
Step 2: Allocate spend to each channel
Give each channel its media, its tools and its share of people time. Write the allocation rule in one sentence, for example “people cost follows the share of hours logged”.
Step 3: Divide and compare within a sales motion
Divide each channel’s loaded spend by its new customers. Compare channels that share a motion. Self-serve and sales-assisted motions have structurally different costs, so a direct comparison mostly measures deal size.
Step 4: Convert CAC into months to recover it
Divide CAC by the monthly gross margin one new customer produces. Skok calls this the months to recover CAC, and says “the profitability is anemic if the time to recover CAC extends beyond 12 months”, while stressing that these are only guidelines.
What does a worked example look like? (illustrative numbers)
The numbers below are ILLUSTRATIVE. They are not MV3 results or client results. They exist so you can follow the arithmetic and copy the structure. Assume one quarter, 14 new customers, and USD 1,500 of monthly recurring revenue per new customer at an 80 percent gross margin, which is USD 1,200 of monthly gross margin each.
| Channel | Media and tools | People | Loaded spend | New customers | CAC |
|---|---|---|---|---|---|
| Paid search | 30,000 | 10,000 | 40,000 | 6 | 6,666.67 |
| Outbound | 8,000 | 24,000 | 32,000 | 4 | 8,000 |
| Content | 6,000 | 16,000 | 22,000 | 2 | 11,000 |
| Referral | 3,000 | 0 | 3,000 | 2 | 1,500 |
| Blended | 47,000 | 50,000 | 97,000 | 14 | 6,928.57 |
Check the sums. Loaded spend is 40,000 plus 32,000 plus 22,000 plus 3,000, which is 97,000. Divided by 14 customers it is 6,928.57. Paid search on media alone is 30,000 divided by 6, or 5,000. Adding the 10,000 of people cost moves it to 6,666.67. That gap of 1,666.67 is what a media-only report hides.
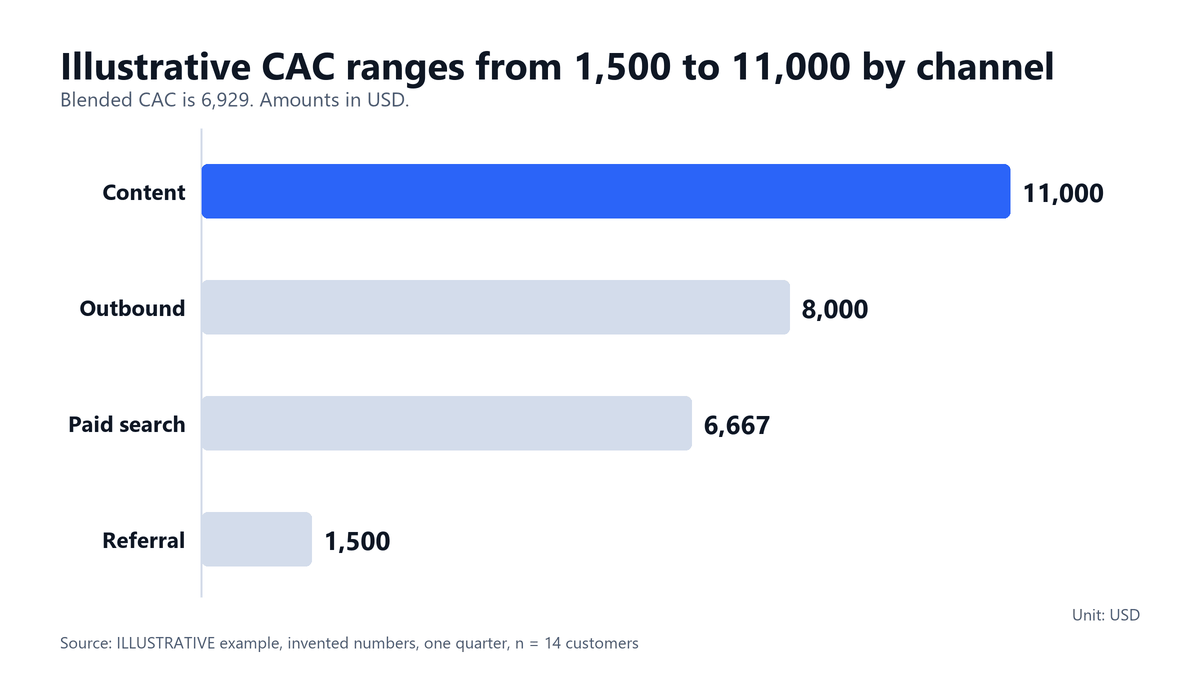
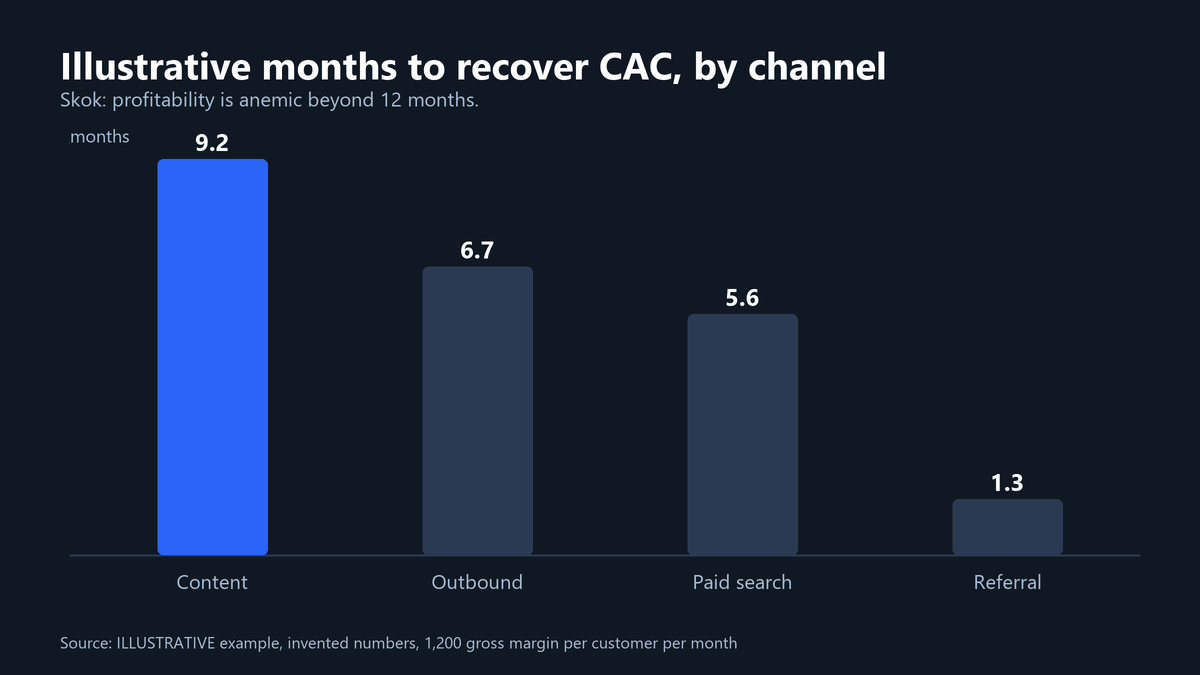
Now convert to months. At 1,200 of monthly gross margin per customer, blended CAC is recovered in 5.77 months. Content takes 9.17 months, outbound 6.67, paid search 5.56 and referral 1.25. Referral looks best because its spend has no people cost here, which is exactly the kind of allocation choice you should question before moving budget.
How do you calculate it in a spreadsheet or SQL?
You need two small tables: spend by channel and customers closed by channel. We ran the query below on a scratch SQLite database loaded with the illustrative figures above, to check that it reproduces the table.
select s.channel,
       s.media_tools + s.people as loaded,
       c.new_customers,
       round((s.media_tools + s.people) * 1.0 / c.new_customers, 2) as cac,
       round((s.media_tools + s.people) * 1.0 / c.new_customers / (1500 * 0.8), 2) as payback_months
from spend s join closed c using (channel)
order by cac desc;
What this does: it joins loaded spend to customers per channel, divides, and converts to months using 1,500 of MRR at 80 percent margin. Output from the run:
Content      22000.0  2  11000.0  9.17
Outbound     32000.0  4   8000.0  6.67
Paid search  40000.0  6   6666.67 5.56
Referral      3000.0  2   1500.0  1.25
Common error: integer division. Multiply by 1.0 first, as above, or your CAC rounds down to a whole number in some databases. In a spreadsheet the same idea is one cell per channel: loaded spend divided by customers.
What did our own CAC data show?
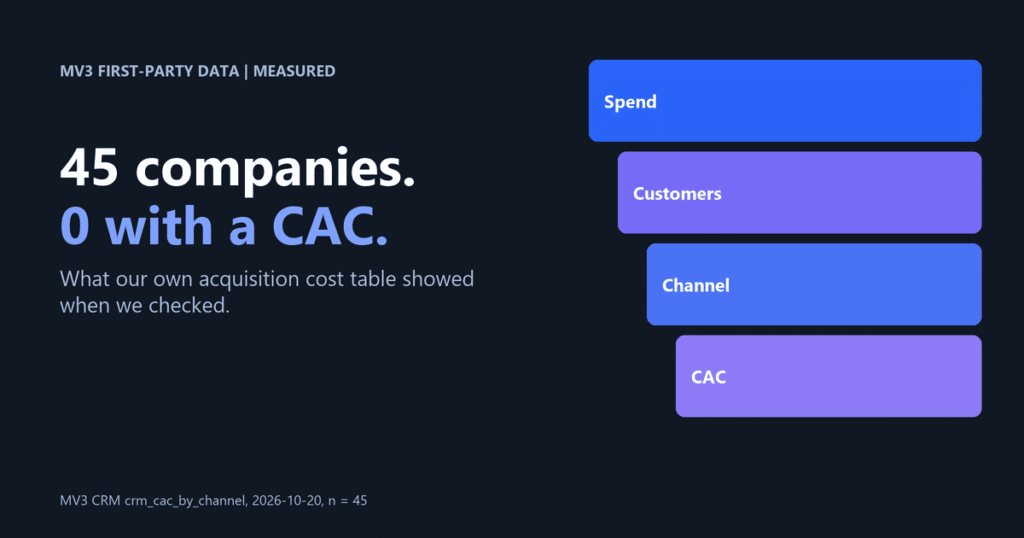
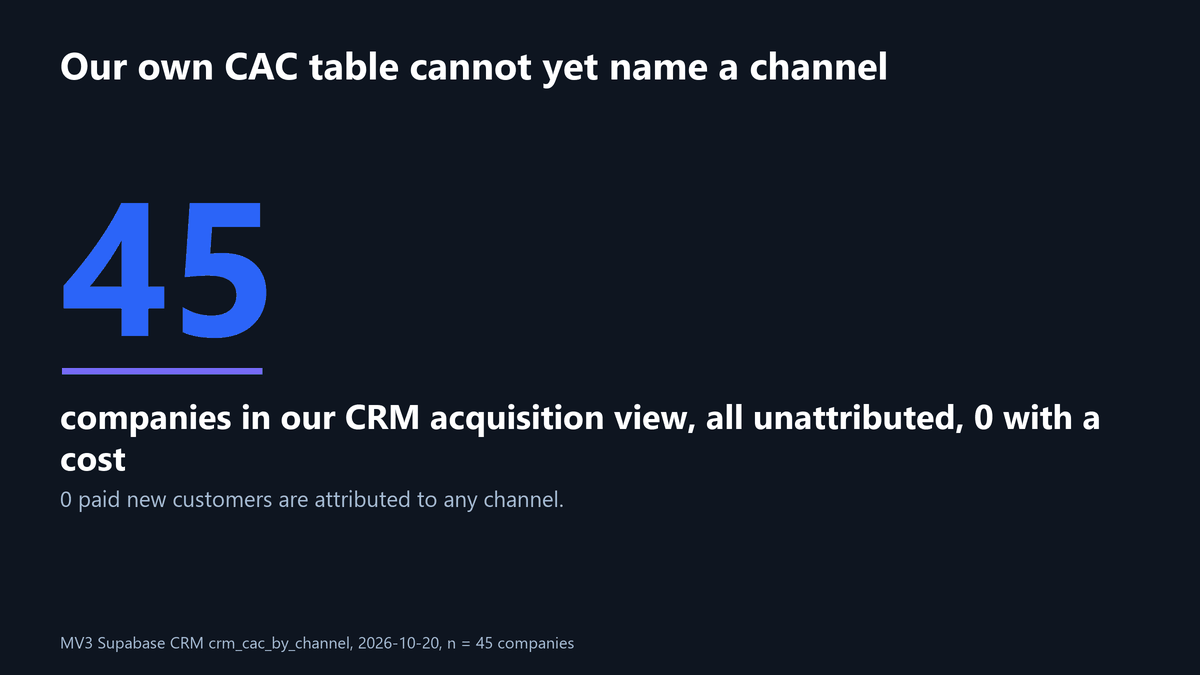
We pulled our own channel table before writing this. On 2026-10-20 the crm_cac_by_channel view in our CRM held 45 companies. All 45 sat in one row labelled unattributed, with 0 acquisition cost recorded against them and 0 paid new customers (MEASURED, MV3 Supabase CRM, retrieved 2026-10-20, n = 45 companies).
That is a diagnosis, not a result. It means MV3 cannot yet compute a channel CAC from its own CRM, because spend and closed customers are not joined by channel. It is a common starting point, and we would rather show it than invent a number.
What this means for you: if your own table looks like ours, do not buy a dashboard first. Join spend by channel to closed customers by channel in one place, starting with the channel whose spend is already itemized.
How does CAC connect to LTV and deal size?
CAC alone does not say whether a channel is healthy. Skok writes that “the best SaaS businesses have a LTV to CAC ratio that is higher than 3, sometimes as high as 7 or 8. And many of the best SaaS businesses are able to recover their CAC in 5-7 months.” Read those as guidelines from one practitioner, not laws.
| Guideline | Stated figure |
|---|---|
| LTV to CAC ratio, best businesses | Higher than 3, sometimes 7 or 8 |
| Months to recover CAC, many of the best | 5 to 7 months |
| Months to recover CAC, profitability becomes anemic | Beyond 12 months |
A pricier channel can still win if its customers stay longer or pay more. For a view of how to credit channels fairly, see our B2B SaaS marketing attribution guide and the ABM ROI attribution framework.
Where do CAC calculations usually go wrong?
| Symptom | Likely cause | Fix |
|---|---|---|
| CAC looks far lower than finance expects | Media-only spend, no people cost | Add allocated salaries and tools |
| CAC spikes in a quarter, then falls | Long sales cycle, spend and wins land in different periods | Use close dates and review a rolling period |
| One channel has two deals and a perfect ratio | Sample too small | Hold judgment until the channel has more closed deals |
| Every channel says unattributed | No source field on the deal | Add a required source at deal creation |
Expect the first attempt to undercount. A deal that takes a quarter to close appears in spend before its customer appears in the count, which inflates CAC temporarily. Note it in your report so nobody reacts to a number that will correct itself.
If you also track the web side of the funnel, our GA4 key events guide shows how to record a real lead event, and our B2B martech stack guide covers the tooling. MV3 sells analytics and attribution setup, so treat that as a disclosed interest. If you want a second set of eyes on your own CAC inputs, book a call with us.
Checklist: a usable CAC in one quarter
- One written definition of spend, including people time.
- One customer list with close dates and a channel for every row.
- CAC per channel and blended, side by side.
- Months to recover CAC next to each channel, using gross margin.
- A note on anything allocated by judgment.
FAQ
What counts as acquisition cost in a CAC calculation?
Media, tools tied to acquisition, and the allocated salary and commission time of the people who produce customers. Support and renewal costs after the sale stay out.
How often should B2B SaaS teams recalculate CAC?
Quarterly for the headline number, monthly for a trend line. Long sales cycles make weekly figures swing without meaning.
Is a lower CAC always better?
No. A cheap channel that brings customers who leave quickly can cost more over time than a pricier channel with durable accounts, so read CAC next to retention and margin.
What is a good CAC payback period?
Skok reports that many of the best SaaS businesses recover CAC in 5 to 7 months and that profitability turns anemic beyond 12 months. He says these are guidelines, not rules.
Can we compare self-serve and sales-assisted CAC directly?
Not usefully. The motions have different cost structures, so compare channels inside the same motion first.
Share this article

Vance Moore is Chief Growth Officer at MV3 Marketing and leads its team of SEO professionals, engineers and auditors.
Ready to audit your organic growth opportunity?
$2,500 flat. 5 business days. Six deliverables tied to pipeline , not rankings. No retainer required.
Get the Organic Growth Audit →