What “good” SEO looks like for a SaaS company right now
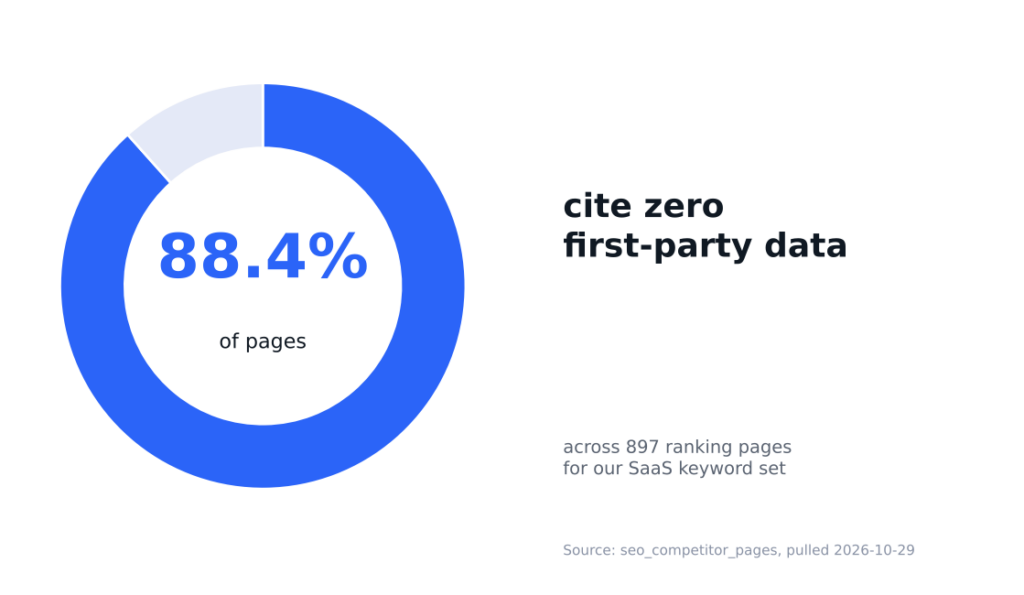
We audited 897 pages currently ranking for the keywords we track for our own B2B SaaS content plan. The pages are not short or lazy. They average 2,433 words and 17 images each. What they are missing is originality. Only 16.8 percent carry FAQ schema markup, and the average page cites close to zero first-party data points of its own. This holds across every topic we checked, from pure technical SEO terms to broader B2B marketing concepts, which tells us the gap is not specific to one subcategory of SaaS content. It looks structural to how most teams produce this kind of content in the first place: start from what competitors already said, polish the wording, add stock-style images, and skip the step of running an original number.
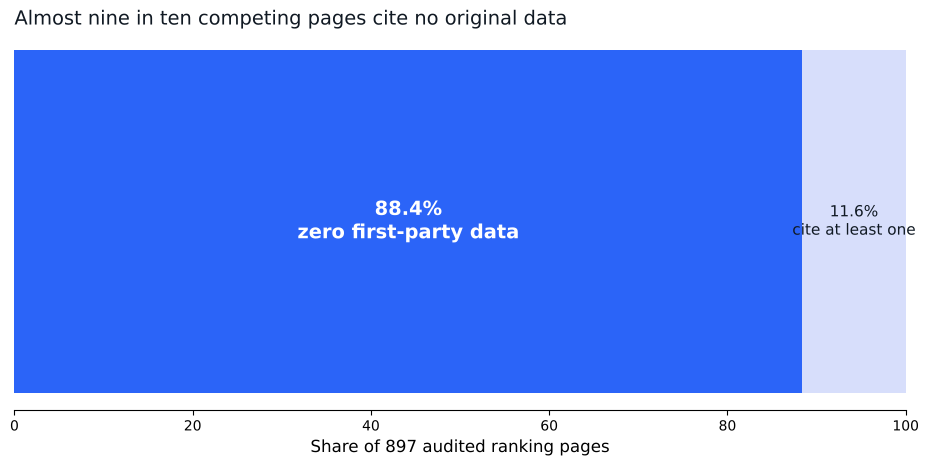
Source: seo_competitor_pages table (Supabase), pulled 2026-10-29, n = 897 audited pages across our tracked keyword set.
Where our own site actually stands today
We are not writing this from a position of having solved search. Our own Search Console data for the last two weeks shows impressions climbing, clicks slipping, and average position getting slightly worse, not better. Weekly impressions rose from 15,776 to 21,105, a 34 percent increase, over the period we pulled. Clicks fell from 28 to 17 in the same window. Average position moved from 33.18 to 39.02, worse rather than better. We are publishing the trend as it is, not as we would prefer it to read.
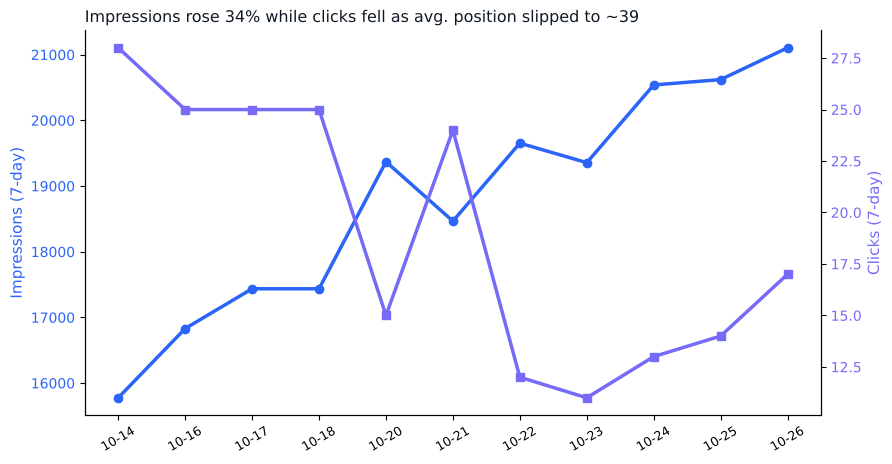
Source: gsc_site_daily table (Supabase), pulled 2026-10-29, n = 11 daily snapshots from 2026-10-14 to 2026-10-26.
Reading the trend correctly instead of picking the flattering number
It would be easy to publish only the impressions line and call it growth. Over the same 11 daily snapshots, click-through rate moved between roughly 0.06 percent and 0.18 percent, which is consistent with an average position in the high thirties rather than a ranking problem unique to us. Position in the high thirties sits on page four of results, where click-through rate is low almost everywhere, for any site. The honest read is that more of our pages are being indexed and surfaced for more queries, which is a real and useful signal on its own, while the specific pages driving those impressions have not yet climbed high enough to convert that visibility into clicks.
We are including this section because a SaaS content team working from vanity metrics alone would have stopped at “impressions up 34 percent” and moved on. Pairing impressions with clicks and average position is a five-minute check against one table, and it changes the story from a win to a work-in-progress, which is the more useful read for planning the next quarter of content.
Why this gap matters more for SaaS than for most categories
B2B SaaS buyers read several competing explanations of the same concept before they ever talk to a salesperson. When every explanation says roughly the same thing with no evidence behind it, the buyer has no reason to remember any one source. A page that shows its own numbers, even modest or mixed ones like the Search Console trend above, gives a reader something concrete to cite back to a colleague.
This is also the reasoning behind our own content process. Every post we queue gets checked against our keyword research process for B2B SaaS and against the real competing pages for that keyword before a single sentence gets written, which is the same evidence-first standard we use for clients through our content and SEO work.
The shape of a typical ranking page
Across the 897 pages we audited, three numbers describe the typical page: 2,433 words, 17 images, and under one table per page on average. None of those numbers are small. The content is not thin in the traditional sense. It is thin in the sense that matters more for a reader trying to make a decision: it rarely shows original work.
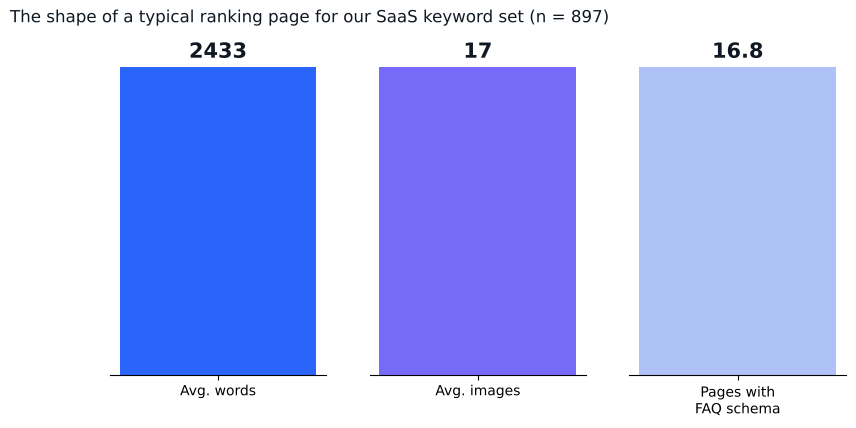
Source: seo_competitor_pages table (Supabase), pulled 2026-10-29, n = 897 audited pages.
What this means for a SaaS content plan
If you run SEO for a SaaS company, the practical takeaway is not “write more.” The average competing page is already long. The takeaway is to attach a real data point, chart, or table to the claims you are already making. A customer segment breakdown, a before-and-after metric, or an audit of your own tracked keywords all qualify, as long as the source and date are stated plainly next to the number.
We built this entire piece from a small set of our own tables: a keyword tracker, a competitor page audit, and a daily Search Console snapshot. None of that required specialized research. It required deciding in advance to keep the data and query it rather than estimate from memory. Any team running SEO for a SaaS product can build the same habit with the technical audit checklist we use as a starting structure.
The cadence matters too. A one-time audit tells you where competing pages stand on the day you looked. Our own numbers already moved over an 11-day window, which means a single snapshot would have missed the clicks decline entirely. We re-pull our Search Console snapshot and competitor audit on a recurring basis specifically so a short-term swing does not get mistaken for a durable trend in either direction.
What we found
The single clearest finding across every number in this piece is the first-party data gap. Nearly nine in ten competing pages for our tracked keyword set show no original data at all, despite being long and well illustrated. The second finding is more humbling: our own trend line is mixed right now, impressions up, clicks down, position slightly worse. We think that is worth publishing anyway, because a content strategy built on cherry-picked wins is not one we would trust from anyone else either.
FAQ
Does SEO for SaaS companies need to be different from SEO for other B2B categories?
Not structurally. The keyword research, content planning, and technical basics are the same. The difference is how fast SaaS buyer research moves and how many competing explanations a buyer reads before a trial signup, which raises the value of showing original evidence rather than restating definitions.
Is a 34 percent rise in impressions a good result on its own?
Not by itself. In our case it came alongside falling clicks and a slightly worse average position, which points to more of our pages showing up for more queries without ranking high enough yet to be clicked. Impressions and clicks need to be read together.
How many first-party data points does a page need to stand out?
There is no fixed number. Our own competitor audit shows the average ranking page has close to zero, so even one well-sourced chart or table already puts a page ahead of most of what currently ranks.
Want an audit like this one run against your own tracked keywords? Book time with us.
Share this article

Vance Moore is Chief Growth Officer at MV3 Marketing and leads its team of SEO professionals, engineers and auditors.
Ready to audit your organic growth opportunity?
$2,500 flat. 5 business days. Six deliverables tied to pipeline , not rankings. No retainer required.
Get the Organic Growth Audit →