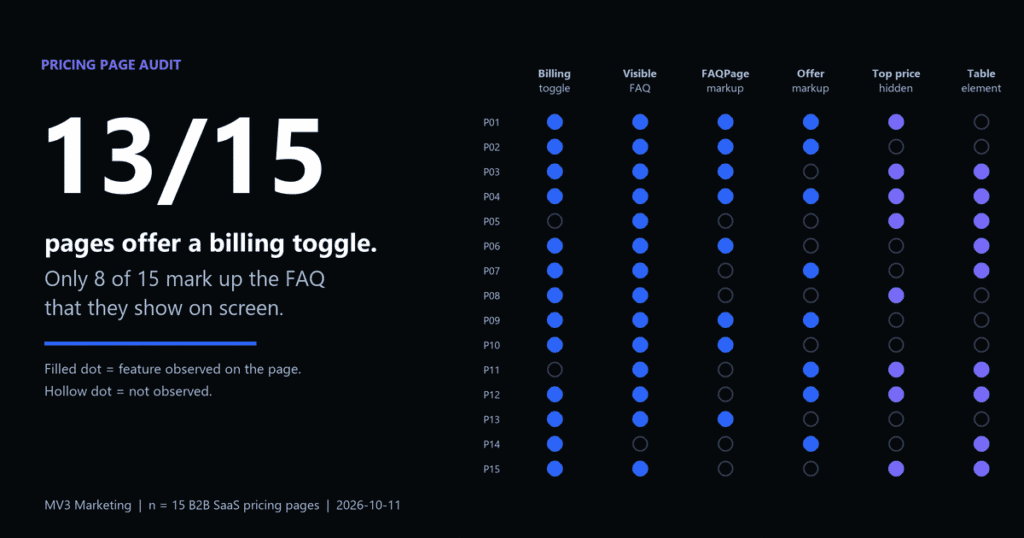
We ran this audit ourselves on 15 public B2B SaaS pricing pages on 2026-10-11, so every step comes with a measured baseline. MV3 Marketing sells conversion and SEO services, so we have a commercial interest in you doing this work.
Before you start
- Tools: Chrome with DevTools, Python 3 (standard library only), a spreadsheet and a schema validator.
- Time: about 90 minutes per page (estimate), for someone comfortable in DevTools.
- What you will have: a scorecard of 12 checks per page and a ranked fix list.
Our sample: 15 public pricing pages, loaded once each with a Chrome user agent at 1440 by 900 pixels, a few seconds apart. Eight candidates were replaced because they failed to load, rendered unstyled, returned a 404, or split plans into groups. Plan counts and billing defaults were read by eye from screenshots. Everything else came from the rendered page.
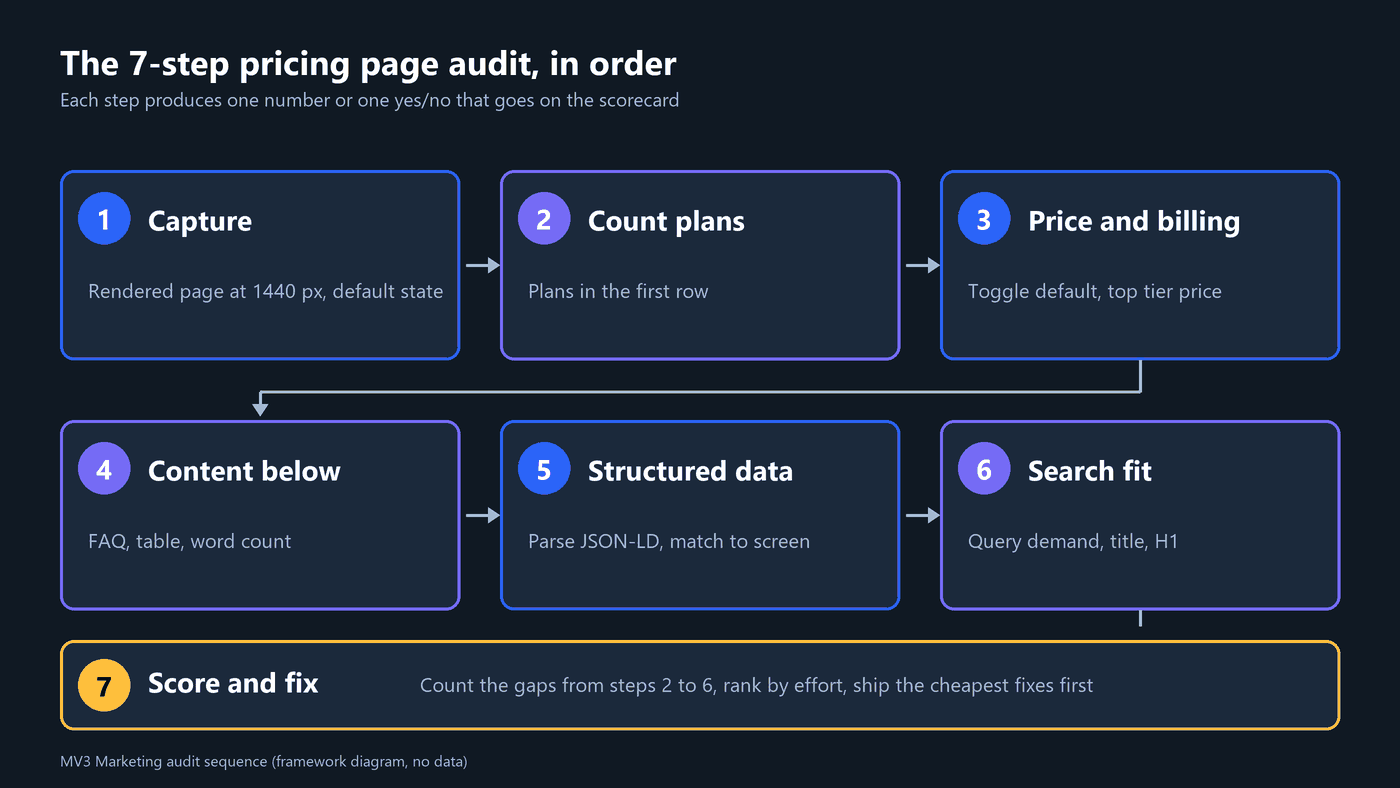
Step 1: Capture the page as a buyer sees it
Open the page in a clean browser profile at 1440 px wide, then again at 390 px. Screenshot the first screen exactly as it loads, with the cookie banner, chat widget and default billing state. Save the rendered HTML as well as the page source, because plan cards are often built in the browser.

Expected result: two screenshots and one saved HTML file per page, named with the date. Common mistake: auditing while logged in or from another country, which can change plans or currency.
Step 2: Count the plans and name each plan’s job
Count the plan columns in the first plan row, then write one word for each plan’s job: try, team, scale or custom. In our 15 pages, 11 showed four plans, 3 showed three and 1 showed five. That describes peers. It does not prove four plans convert best, because we measured layout, not revenue.
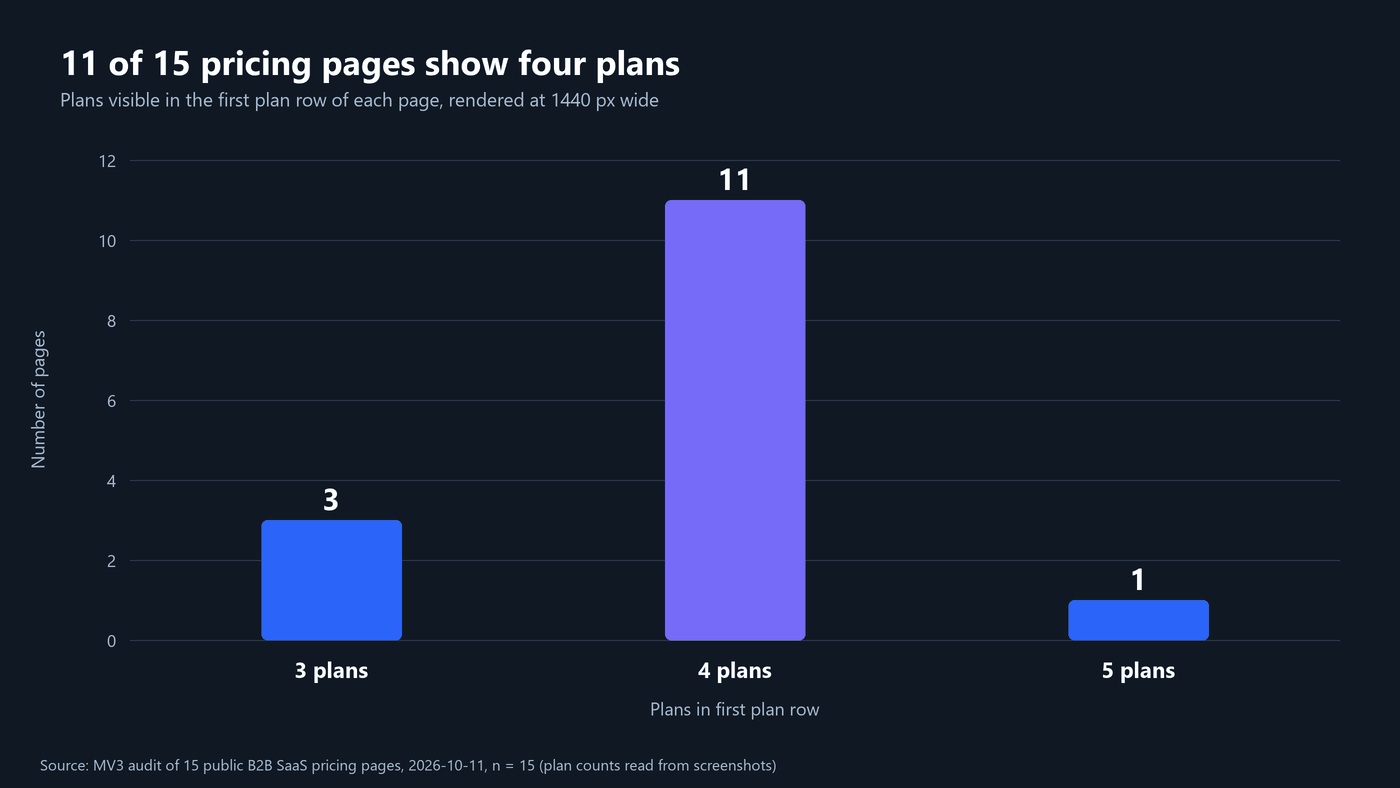
Source: MV3 audit of 15 public B2B SaaS pricing pages, 2026-10-11, n = 15.
Expected result: a plan count and a note on any recommended badge. Common mistake: counting add-ons or usage tiers as plans. One page in our sample sells a helpdesk plus an AI agent, so we counted its three helpdesk plans only.
Step 3: Check billing and price visibility
Find the monthly and annual control, read which state it loads in, and record whether the top plan shows a price. 13 of 15 pages showed a billing control on the first screen. We could read the default on 10 of them: 8 opened on annual billing and 2 opened on monthly. 8 of 15 withheld the top plan’s price behind a contact sales button, a custom price label or a billing note, which means a buyer cannot size the budget alone. That is a normal enterprise choice. The audit question is whether the page says what happens next.
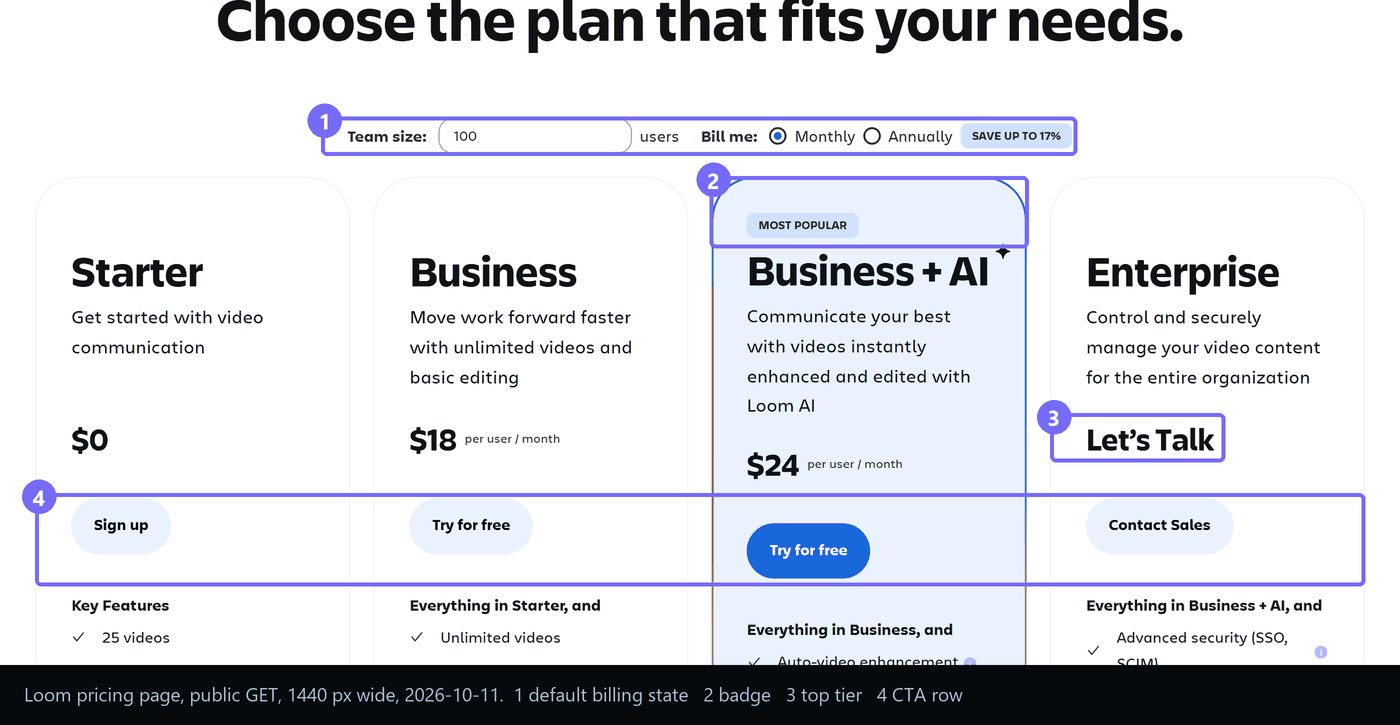
Expected result: three fields per page: control present, default state, top-plan price shown. Common mistake: trusting the headline price. Read the small print: per seat or flat, annual billing or not.
Step 4: Review the content below the plan cards
Scroll past the cards and list what a buyer meets next: a comparison table, an FAQ, a security note, proof. 14 of 15 pages had an FAQ or Q&A block (found by heading text or expandable details), 9 had a table element, and visible text ran from 857 to 2,453 words with a median of 1,309. Those counts include navigation and banners, so compare your own pages the same way. See also our guide to AEO content structure for B2B SaaS.
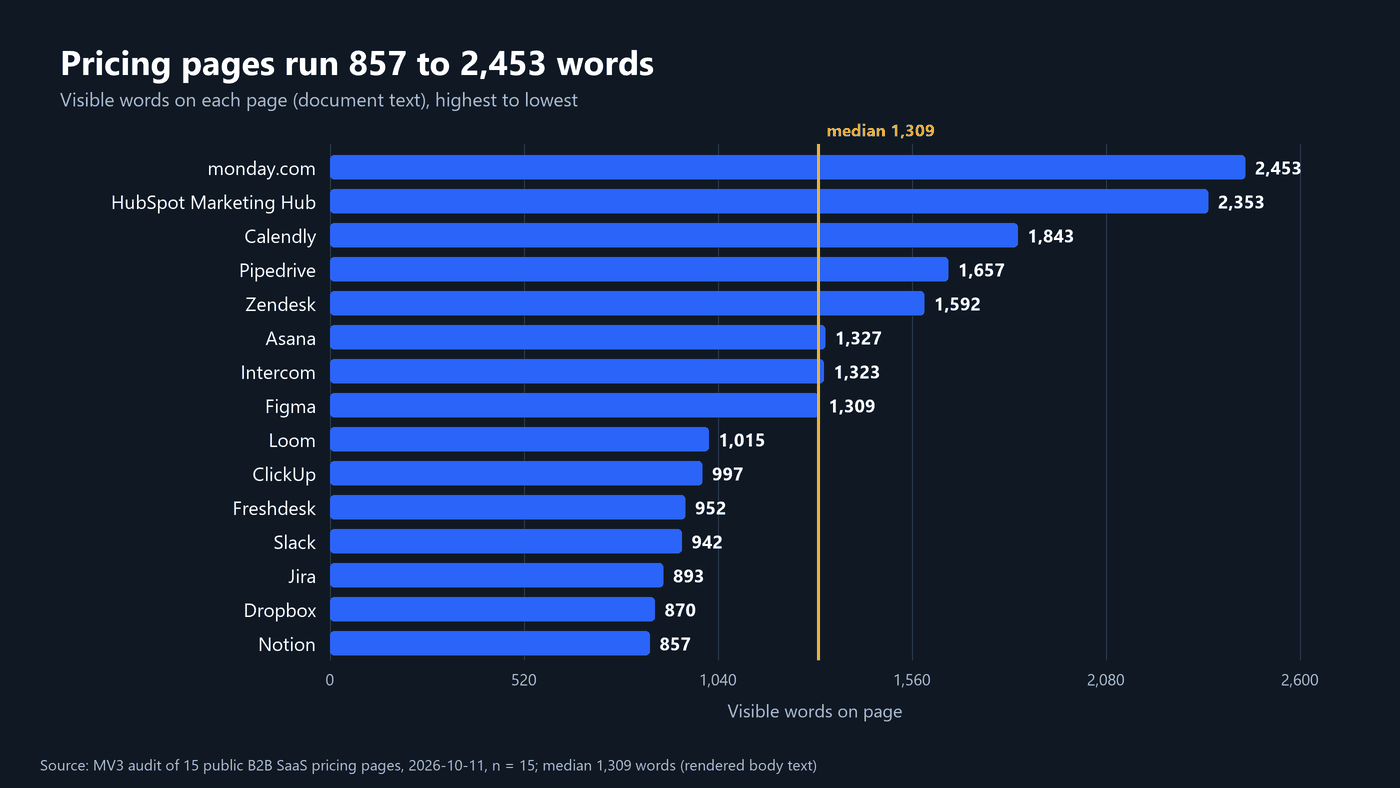
Source: MV3 audit of 15 public B2B SaaS pricing pages, 2026-10-11, n = 15.
Expected result: a list of buyer questions answered and missing. Common mistake: writing FAQ answers as marketing copy. Draw the questions from sales calls, chat logs and support tickets.
Step 5: Parse the structured data
Find every application/ld+json block in the source, confirm it parses, then match the markup to what is visible. In our sample, 12 of 15 pages carried some JSON-LD, 8 carried FAQPage markup and 8 carried Offer markup. Six pages showed an FAQ on screen with no FAQPage markup. Google’s documentation changelog states that the FAQ rich result is shown only for well-known, authoritative government and health sites, so mark up FAQs for consistency, not to win a rich result. Google’s software app documentation shows a SoftwareApplication with an offers object holding price and priceCurrency, the pattern to copy when plan prices are public. Our technical SEO audit checklist covers wider crawl checks.
This script lists the schema types on a public page.
import json, re, sys, urllib.request

UA = "Mozilla/5.0 (Windows NT 10.0; Win64; x64) AppleWebKit/537.36 (KHTML, like Gecko) Chrome/124.0 Safari/537.36"
html = urllib.request.urlopen(urllib.request.Request(sys.argv[1], headers={"User-Agent": UA}), timeout=30).read().decode("utf-8", "ignore")
blocks = re.findall(r'<script[^>]+application/ld+json[^>]*>(.*?)</script>', html, re.S)

def types(node):
    if isinstance(node, list):
        for n in node: yield from types(n)
    elif isinstance(node, dict):
        t = node.get("@type")
        if t: yield from ([t] if isinstance(t, str) else t)
        for v in node.values(): yield from types(v)

found = set()
for b in blocks:
    try: found |= set(types(json.loads(b)))
    except json.JSONDecodeError: print("invalid JSON-LD block")
print(len(blocks), "block(s):", sorted(found & {"FAQPage", "Offer", "Product", "SoftwareApplication", "BreadcrumbList"}))
Run it as python jsonld_types.py URL. On the Intercom pricing page, 2026-10-11, it printed the line below. Common error: it reports 0 blocks when a page injects JSON-LD with JavaScript, so confirm in the DevTools Elements panel.
2 block(s): ['BreadcrumbList', 'FAQPage', 'Offer', 'SoftwareApplication']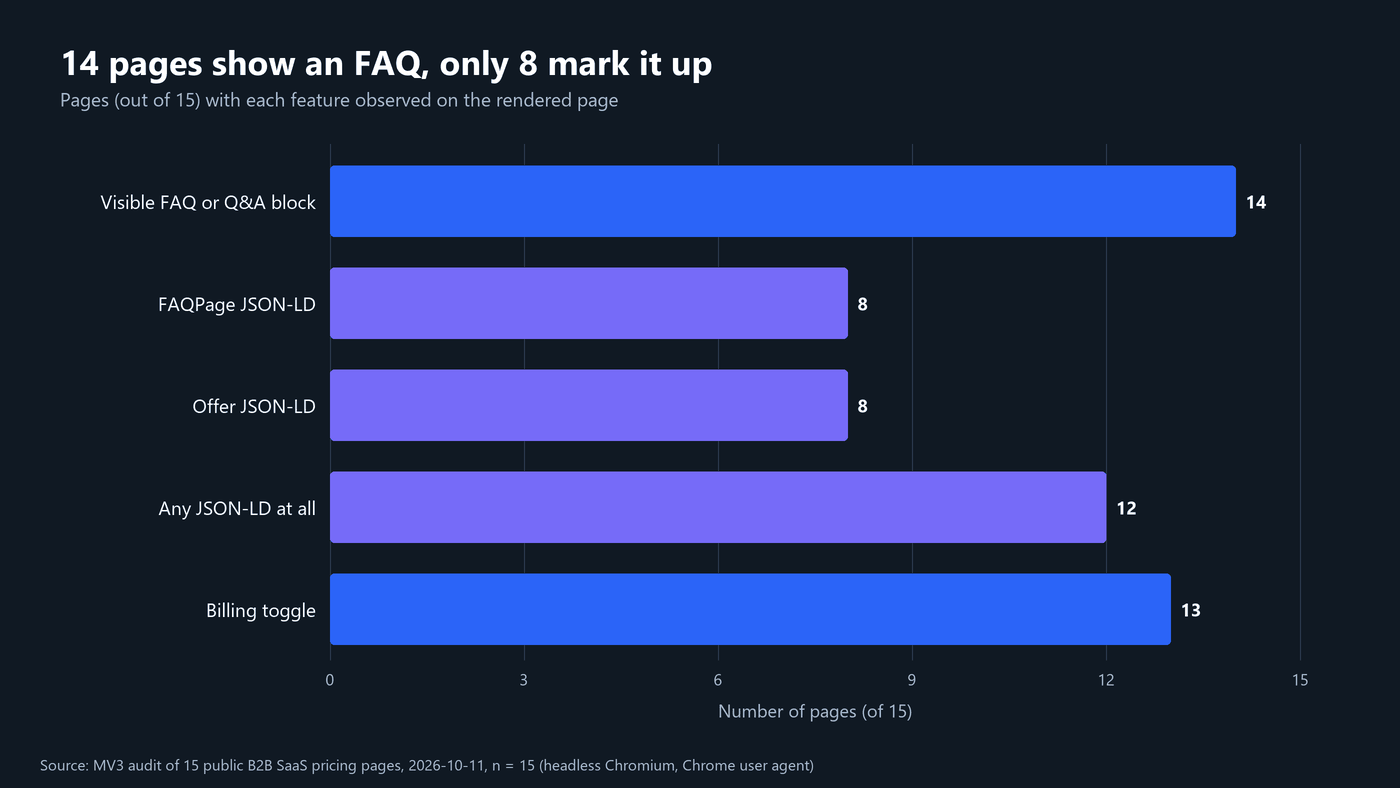
Source: MV3 audit of 15 public B2B SaaS pricing pages, 2026-10-11, n = 15. JSON-LD validity was not tested.
Expected result: a list of types found and a note on any markup that does not match the screen. Common mistake: marking up an FAQ or a price that the page does not show.
Step 6: Check search fit and demand
Pricing pages are mostly branded, so the keyword work is small. Check that the title and H1 name the product and the word pricing, that the page has one clear target query, and that demand exists. We queried DataForSEO (Google Ads data, US, English) on 2026-10-11: pricing page design 110 monthly searches, saas pricing page examples 40, saas pricing page 30, saas pricing page design 20 and pricing page best practices 10. Three phrases, including pricing page audit, returned no volume. Our own keyword table held no pricing page rows either. So the page earns its keep through conversion and clear answers, not traffic volume.
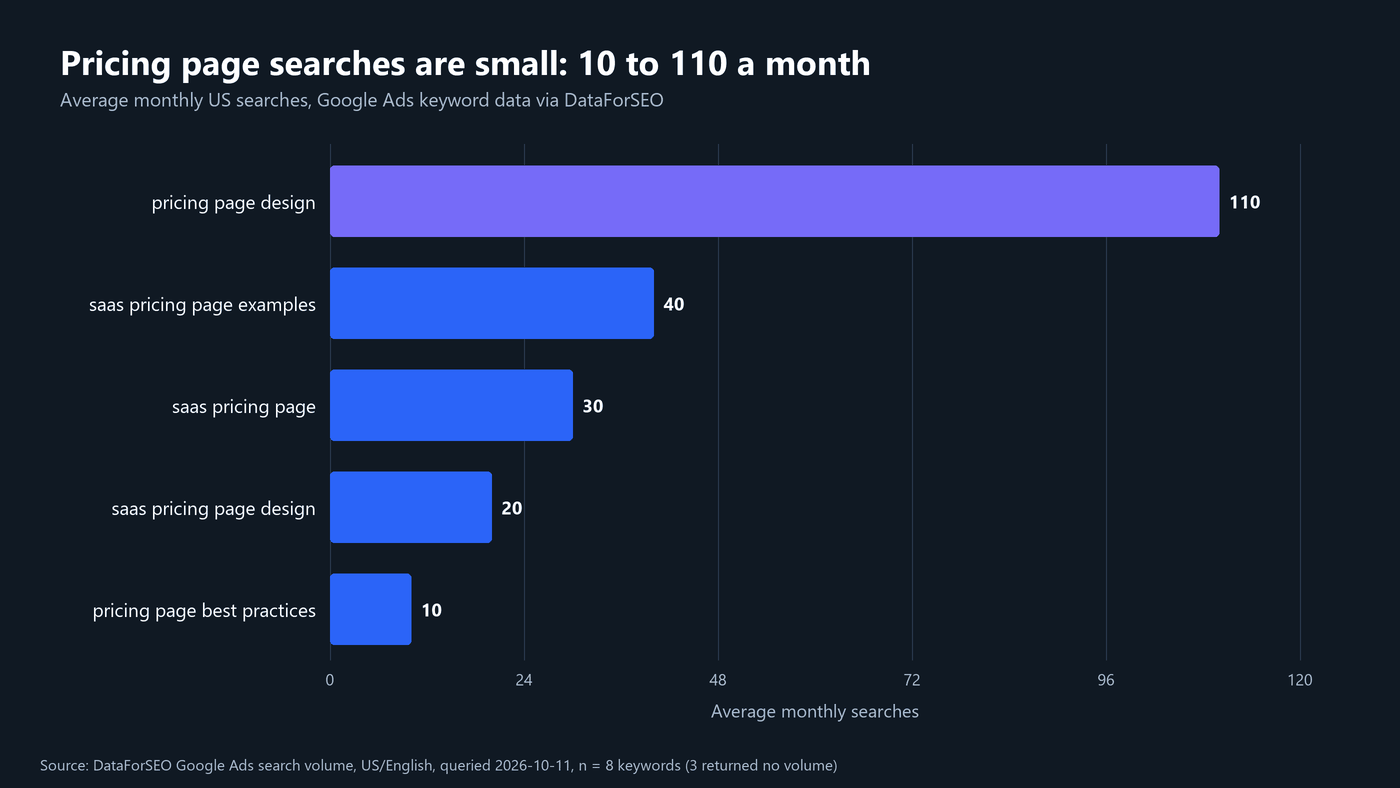
Source: DataForSEO Google Ads search volume, US/English, queried 2026-10-11, n = 8 keywords.
Expected result: one target query per page, with its volume or the note no data. Common mistake: stuffing pricing variants into the title. One page gets one primary query.
Step 7: Score the page and rank the fixes
Give each check one point for a pass and zero for a fail, then rank the zeroes by effort. Schema fixes and FAQ rewrites take hours. Plan changes need sales and finance. Ship the cheap fixes first and log the date, so you can compare conversion and impressions before and after. Check tracking first with our GA4 audit checklist. Expected result: a one page scorecard. Common mistake: redesigning the plans before measuring anything.
Checklist recap
Copy this table into a spreadsheet, one row per page. Pass rules are MV3 opinion. The last column is measured.
| Step | Check | Pass rule (MV3 opinion) | Observed in our sample |
|---|---|---|---|
| 1 | Rendered screenshot and source saved | Both saved with the date | Process step |
| 2 | Plans counted, jobs named | 3 to 5 plans, each with its own call to action | 11 pages showed 4 plans, 3 showed 3, 1 showed 5 |
| 3 | Billing control and default read | Control present, default recorded | 13 of 15 had a control on the first screen |
| 3 | Top plan sets a budget expectation | Starting price, range or next step shown | 7 of 15 showed a top plan price |
| 4 | FAQ answers real buyer questions | Questions drawn from sales or support | 14 of 15 had an FAQ block |
| 4 | Comparison below the cards | Table or structured list | 9 of 15 had a table element |
| 5 | JSON-LD present and parsing | No invalid blocks | 12 of 15 had JSON-LD (validity not tested) |
| 5 | Markup matches the screen | FAQPage if FAQ shown, Offer if price shown | 8 had FAQPage, 8 had Offer |
| 6 | One target query, title and H1 aligned | Query named with volume or no data | 3 of 8 phrases returned no volume |
| 7 | Scorecard and ranked fix list | Zeroes ranked by effort | Process step |
Troubleshooting
| Symptom | Likely cause | Fix |
|---|---|---|
| Plan cards are missing from the saved HTML | Cards are built by JavaScript | Audit the rendered DOM in DevTools or save the page from a headless browser |
| The script prints 0 blocks but the page has markup | JSON-LD is injected after load | Check the Elements panel for application/ld+json |
| Keyword tool shows no volume | The phrase is too specific | Use the broader parent phrase and record no data |
FAQ
How long does a pricing page audit take?
About 90 minutes for the first page (our estimate), faster once the script and scorecard exist.
Should a pricing page use FAQPage markup?
Use it only when the FAQ is visible and the answers match the markup. Google’s documentation limits the FAQ rich result to well-known government and health sites, so do not expect a rich result.
Should the top plan show a price?
That is a business choice. In our sample 8 of 15 hid it and 7 showed it. If you hide it, say what the buyer gets next.
Want this audit run on your pricing page with a written scorecard? Book a call with MV3 Marketing.
Share this article

Vance Moore is Chief Growth Officer at MV3 Marketing and leads its team of SEO professionals, engineers and auditors.
Ready to audit your organic growth opportunity?
$2,500 flat. 5 business days. Six deliverables tied to pipeline , not rankings. No retainer required.
Get the Organic Growth Audit →