Most churn rate reduction advice reads the same way: survey your customers, send a win-back email, build a loyalty program. We pulled the top-ranking pages for five churn-related search phrases to see what is actually out there, and the pattern was not about tactics. It was about structure.
What We Found in the Data
We queried our own DataForSEO-sourced tables for the five keyword variants searchers use for this problem and the pages currently ranking for them.
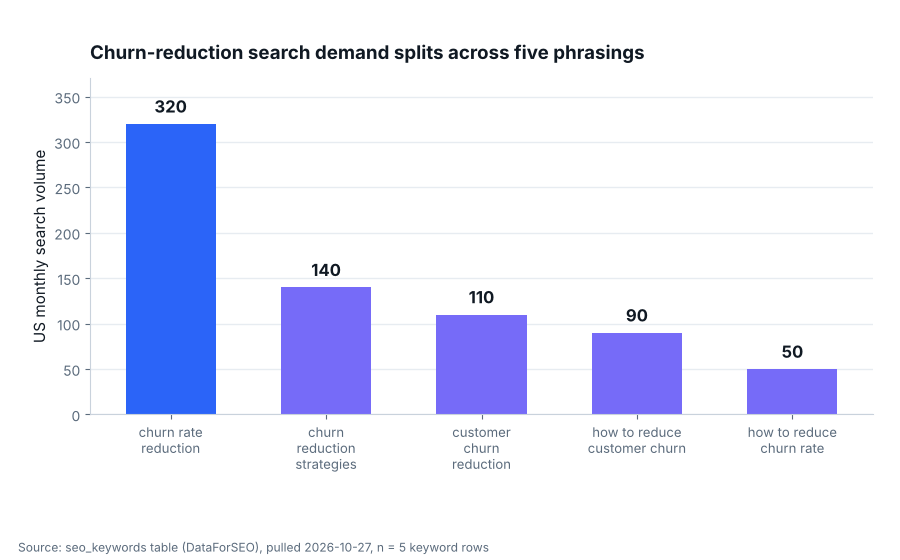
Source: seo_keywords table (DataForSEO), pulled 2026-10-27, n = 5 keyword rows.
Search volume for this topic is split across five close phrasings rather than concentrated in one. “Churn rate reduction” leads at 320 monthly US searches, “churn reduction strategies” sits at 140, “customer churn reduction” at 110, “how to reduce customer churn” at 90, and “how to reduce churn rate” at 50. No single phrasing dominates, which tells us searchers are not agreed on the vocabulary. They are agreed on the problem.
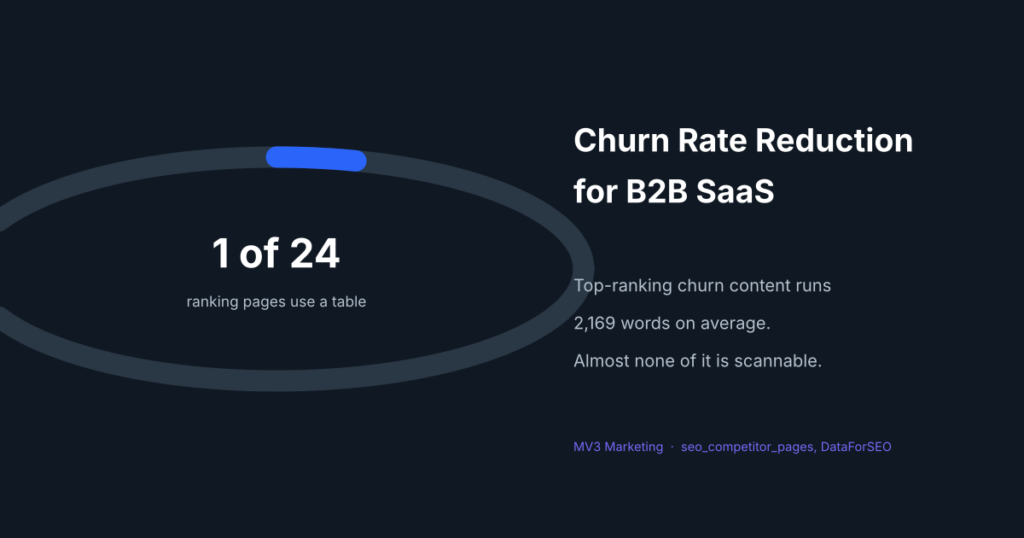
We then pulled the five top-ranking pages for each of those phrasings, 25 pages in total, and read their structure (one page returned no readable data, leaving 24 with full structural data). The average page runs 2,169 words. Only one of those 24 pages uses any kind of data table. Only two carry FAQ schema. Fifteen cite at least one first-party data point of their own, which means most of the rest is restating general advice at length.
| Signal | Pages with it | Share |
|---|---|---|
| Uses any data table | 1 of 24 | 4 percent |
| Carries FAQ schema | 2 of 24 | 8 percent |
| Cites a first-party data point | 15 of 24 | 63 percent |
Source: seo_competitor_pages table (DataForSEO SERP data), pulled 2026-10-27, n = 24 of 25 pages (1 page returned no readable structural data).
That gap matters beyond SEO. If the content customers find when they search for help is 2,000 words of unscannable advice, your own self-serve retention content is probably failing the same customers your success team is trying to save. The fix below treats churn rate reduction as an operating sequence, not a content problem, but we built the visuals to be the scannable version that most of what ranks is not.
Before You Start
| Requirement | Why it matters |
|---|---|
| Product usage data by account | Without it, every risk flag is a guess |
| A shared renewal date calendar | Save plays only work with lead time |
| One owner for the save play | Split ownership between sales and CS kills follow-through |
| Time estimate | 2 to 4 weeks to stand up signals and a first save play, then ongoing weekly review |
Step 1: Instrument the Early-Warning Signals
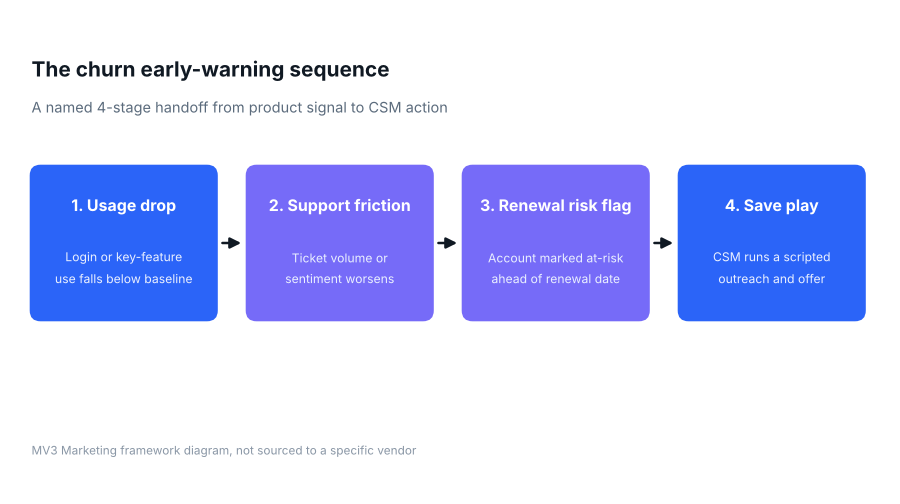
Source: MV3 Marketing framework diagram, built from common product and support signal patterns, not vendor-specific.
Before you can reduce churn rate, you need a signal that fires earlier than the renewal conversation. The sequence we use has four stages: a usage drop against the account’s own baseline, rising support friction, a renewal risk flag applied by a person or a rule, and the save play itself. Each stage should have one clear owner.
Expected result: accounts get flagged at-risk weeks before renewal instead of during it.
Common mistake: treating a single login dip as a signal. One week of low usage is noise. Compare against a rolling baseline, not a single data point.
Step 2: Segment Who Is Actually at Risk
Not every flagged account needs the same save play. Split flagged accounts into at least two tiers: accounts with a usage drop alone, and accounts with a usage drop plus support friction. The second tier churns faster and deserves a human call, not an email sequence.
Expected result: your success team spends its limited time on the accounts most likely to actually leave.
Common mistake: running the same generic “we miss you” email to every flagged account regardless of tier. It reads as automated because it is, and it trains customers to ignore it.
Step 3: Build a Save Play per Tier
A save play is a scripted sequence, not a single email. For the lower-risk tier, that might be a product education touch plus a check-in from customer success. For the higher-risk tier, it should include a named owner, a specific offer or concession authority, and a deadline for the account to respond before escalation.
Expected result: every at-risk account gets a consistent, documented response instead of an improvised one.
Common mistake: giving the save play to whoever happens to notice the flag. Without a named owner, flagged accounts sit untouched until the renewal date arrives on its own.
Step 4: Fix the Structural Leaks Outreach Cannot Patch
Some churn has nothing to do with engagement. Confusing pricing tiers, a rough onboarding handoff, or a feature gap that a competitor fills will keep producing churn no matter how good the save play is. If your customer acquisition cost is rising at the same time churn is, that is usually a sign the two are connected: you are acquiring accounts that do not fit, and no save play fixes a fit problem.
Expected result: fewer accounts enter the at-risk pipeline in the first place.
Common mistake: running save plays indefinitely on a segment that churns for structural reasons, instead of fixing the product or sales-qualification issue underneath.
Step 5: Review the Rate Monthly, Not Just at Renewal
Churn rate reduction is a monthly operating number, not a quarterly report. Review flagged accounts, save play outcomes, and the churn rate itself on a fixed monthly cadence, and separate voluntary churn (the customer chose to leave) from involuntary churn (a failed payment or expired card). Those two need different owners and different fixes; our guide to auditing involuntary churn and dunning recovery covers the payment-failure side specifically.
Expected result: you catch a worsening trend inside a month instead of at the next quarterly business review.
Common mistake: blending voluntary and involuntary churn into one number. A spike in failed payments looks identical to a spike in dissatisfaction unless you split them.
Troubleshooting
| Symptom | Likely cause | Fix |
|---|---|---|
| Save plays launch too late | Risk flag fires too close to the renewal date | Move the flag threshold earlier against the usage baseline |
| Save plays launch but do not work | No differentiation by risk tier | Split flagged accounts into at least two tiers with different plays |
| Churn rate looks stable but revenue is not | Blending voluntary and involuntary churn | Track the two separately, starting with payment failures |
| Same accounts keep getting flagged and saved | A structural product or fit issue, not a one-time risk | Escalate to product or sales qualification, not another save play |
Checklist Recap
| Step | Done |
|---|---|
| Usage, support, and renewal-date signals are instrumented and owned | □ |
| Flagged accounts are split into at least two risk tiers | □ |
| Each tier has a documented save play with a named owner | □ |
| Structural churn causes are escalated instead of re-played | □ |
| Voluntary and involuntary churn are tracked and reviewed separately each month | □ |
Where MV3 Fits In
MV3 is a marketing agency, not a customer success platform. We do not build the signal instrumentation in Step 1. Where we get pulled into churn work is downstream of it: writing the save-play content itself, building the self-serve help and lifecycle content that top-ranking pages on this topic mostly get wrong, and connecting retention data back to acquisition so paid channels stop refilling a leaking segment. If that is the gap you have, that is a conversation worth having, not a reason to take the rest of this guide as a pitch.
FAQ
What counts as a good churn rate for a B2B SaaS company?
It depends heavily on contract length and deal size, and we do not have a benchmark figure we can source honestly for this guide. Track your own rate monthly and watch the trend rather than chasing an external number.
How is churn rate reduction different from customer retention?
Retention is the broader goal. Churn rate reduction is the specific operating sequence (usage signals, risk tiers, save plays) that produces a lower churn number as one measurable outcome of retention work.
Should marketing or customer success own churn rate reduction?
Customer success should own the save play itself, since it requires a live relationship with the account. Marketing’s role is upstream (making sure acquisition is not filling the funnel with poor-fit accounts) and in the self-serve content that most of the ranking pages we reviewed still get wrong.
Ready to connect retention and acquisition data properly? Book time with us.
Share this article

Vance Moore is Chief Growth Officer at MV3 Marketing and leads its team of SEO professionals, engineers and auditors.
Ready to audit your organic growth opportunity?
$2,500 flat. 5 business days. Six deliverables tied to pipeline , not rankings. No retainer required.
Get the Organic Growth Audit →