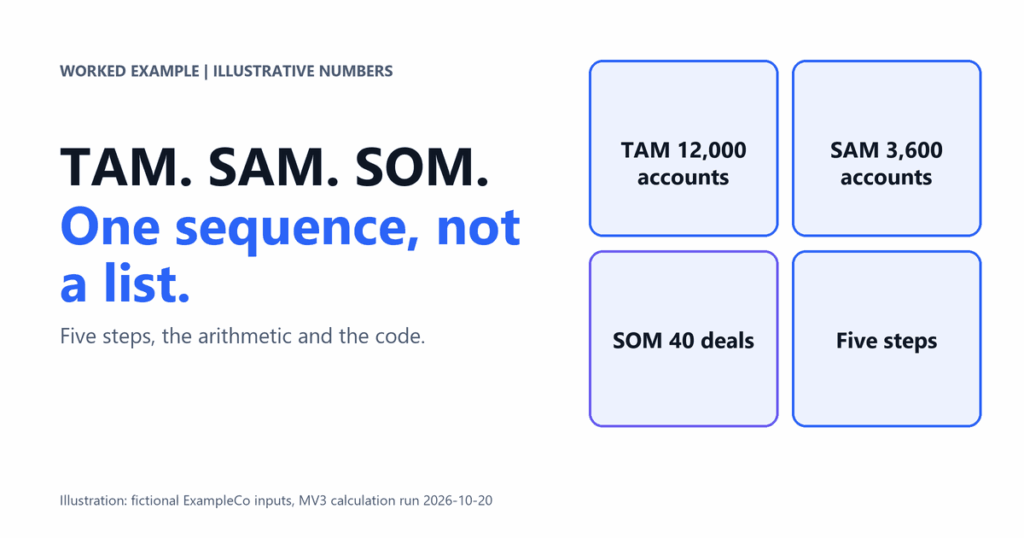
If you searched for tam sam som and found glossary entries, this guide does something different: it walks one calculation from the first input to the last, shows the arithmetic and the code, and lists the errors that make the three numbers useless. We also published a broader method guide, TAM research for SaaS, which covers how to find data sources. This post is the worked example.
What do TAM, SAM and SOM mean?
Wikipedia defines the first number plainly: “Total addressable market (TAM), or total available market, is the total market demand for a product or service” (Wikipedia, Total addressable market). The same page says “Serviceable available market (SAM) is the portion of TAM that is reachable by a company’s distribution footprint” and “Serviceable obtainable market (SOM) is the share of SAM which is realistically achieved by a company.”
Wall Street Prep describes the same ladder from the other end, calling TAM “an all-inclusive, birds-eye view of the entire market” (Wall Street Prep, market sizing). Notice what both sources share. Each number is a subset of the one before it. If your SAM is larger than your TAM, or your SOM is not tied to anything you can sell, the model is broken before you start.

| Term | Unit to count first | Question it answers |
|---|---|---|
| TAM | All accounts that could use the product | How large is the category for us? |
| SAM | Accounts we can reach and serve today | Where can our sales motion actually operate? |
| SOM | Deals our team can close in the period | What can we plan a quota around? |
What do the top results for “tam sam som” leave out?
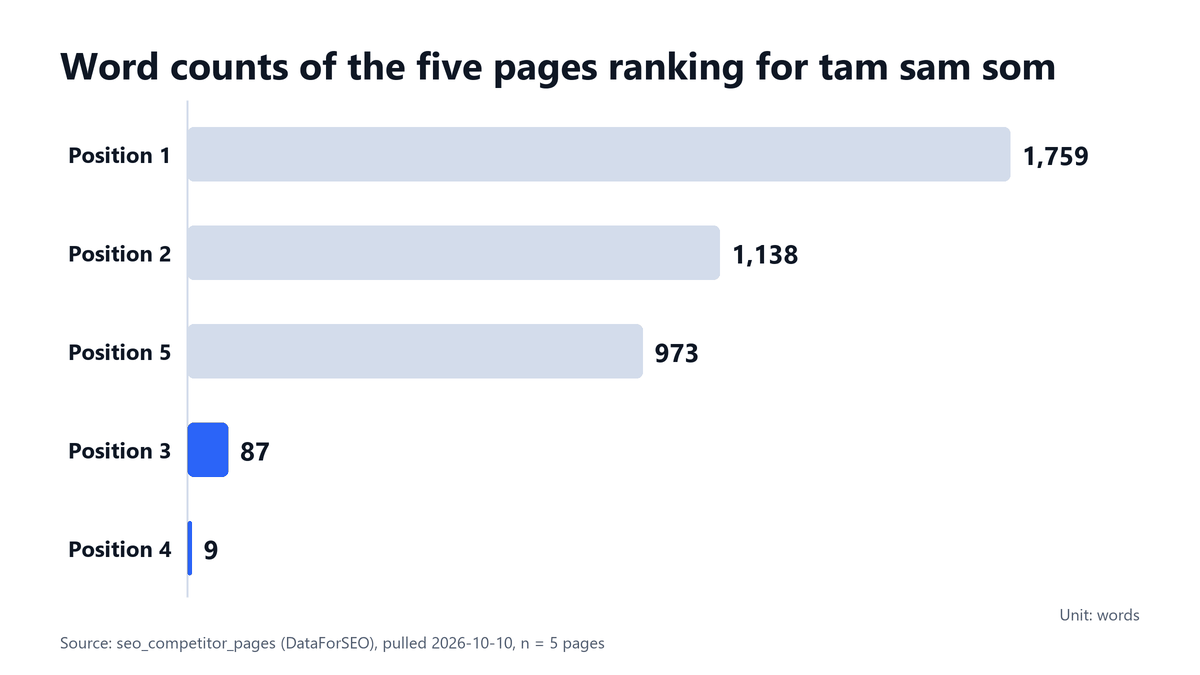
We re-queried our own search data table for this keyword on 2026-10-20. It holds five ranking pages. Their word counts run from 9 to 1,759, the median is 973, two of the five are under 100 words, and one of the five carries FAQ schema (MEASURED, seo_competitor_pages, DataForSEO data pulled 2026-10-10, n = 5). The keyword shows 9,900 monthly searches with LOW competition in our keyword table (MEASURED, seo_keywords, same source).
| Position | Words | Images | Tables | FAQ schema |
|---|---|---|---|---|
| 1 | 1,759 | 25 | 0 | No |
| 2 | 1,138 | 1 | 0 | Yes |
| 3 | 87 | 8 | 0 | No |
| 4 | 9 | 0 | 0 | No |
| 5 | 973 | 0 | 1 | No |
That table shows a gap, not a verdict on any page. Our data records word, image and table counts only, so we make no claim about whether those pages show a worked calculation. The point for you is narrower: a reader who wants arithmetic has to look elsewhere, so this post shows every step.
How do you calculate TAM, SAM and SOM step by step?
The method below uses account counts and contract value, because both come from data you can inspect. The example numbers are illustrative: a fictional workflow tool called ExampleCo, invented for this guide. Replace every input with your own before using any output.

Step 1: Define one account type
Write a single sentence that says which companies could buy. Use filters a data source can run, such as industry, employee band and region. A vague phrase like “mid-market tech” cannot be counted. Expected result: a filter someone else could run and get the same count. Common mistake: mixing buyer types, so the average contract value means nothing.
Step 2: Count TAM
Count the accounts that match, then multiply by average annual contract value. ExampleCo finds 12,000 matching companies and an average contract of 14,000 USD, so TAM is 12,000 x 14,000 = 168,000,000 USD. Use your own closed deals for the contract value, not a competitor price list.
Step 3: Filter down to SAM
Apply only real constraints. ExampleCo can serve 60 percent of accounts by region and 50 percent of those use the one system it integrates with. That gives 12,000 x 0.60 x 0.50 = 3,600 accounts, and 3,600 x 14,000 = 50,400,000 USD of SAM. Expected result: every filter names a limit you could point to, such as a support region or a missing integration.
Step 4: Cap SOM by sales capacity
SOM comes from what your team can close, not from a percentage you like. ExampleCo has 4 reps who each close about 10 deals a year, so 40 deals, or 560,000 USD, which is 1.11 percent of SAM. At a 20 percent win rate that needs 200 qualified opportunities. Common mistake: setting SOM at 5 percent of SAM because it sounds modest, with no pipeline math behind it.

Step 5: Cross-check with a top-down figure
Take a published category size, apply the same two filters, and compare. We cover where such figures come from in the TAM research guide. Wall Street Prep notes that “the quality of a bottom-up build to size a market is contingent on the underlying assumptions” and sums it up as “garbage in, garbage out”, which is exactly why a second method is worth running.
What does the calculation look like in code?
We ran this script with Python on 2026-10-20 and pasted the exact output below. A spreadsheet works the same way: one input per cell, one formula per output.
# Illustrative inputs for a fictional workflow tool. Replace each with your own data.
accounts_in_icp = 12000      # companies matching firmographic filters
acv = 14000                  # average annual contract value, USD
region_share = 0.60          # share of accounts in regions you can serve
integration_share = 0.50     # share of those using the system you integrate with
reps, deals_per_rep = 4, 10  # sales capacity per year

tam = accounts_in_icp * acv
sam_accounts = accounts_in_icp * region_share * integration_share
sam = sam_accounts * acv
som_deals = reps * deals_per_rep
som = som_deals * acv
print(f"TAM accounts {accounts_in_icp:,}  TAM USD {tam:,.0f}")
print(f"SAM accounts {sam_accounts:,.0f}  SAM USD {sam:,.0f}")
print(f"SOM deals {som_deals}  SOM USD {som:,.0f}  share of SAM {som/sam:.2%}")
print(f"Opportunities needed at 20% win rate: {som_deals/0.20:.0f}")
top_down = 840_000_000 * region_share * integration_share
print(f"Top-down SAM USD {top_down:,.0f}  ratio to bottom-up {top_down/sam:.1f}x")
Output of that run:
TAM accounts 12,000  TAM USD 168,000,000
SAM accounts 3,600  SAM USD 50,400,000
SOM deals 40  SOM USD 560,000  share of SAM 1.11%
Opportunities needed at 20% win rate: 200
Top-down SAM USD 252,000,000  ratio to bottom-up 5.0x
What this does. It turns five inputs into TAM, SAM and SOM, then shows the win-rate check. Change one input and every output moves. Common error: typing a share as 60 instead of 0.60, which inflates SAM by a factor of 100.
Why should the top-down and bottom-up numbers disagree?
They usually do. In the ExampleCo illustration, an invented category figure of 840,000,000 USD, filtered by the same 60 percent and 50 percent shares, gives a top-down SAM of 252,000,000 USD, which is 5.0 times the bottom-up 50,400,000 USD. A gap that size is a finding, not an error to average away.

When the numbers split, look for the input that differs. Here the category size includes small companies outside the account definition from Step 1. Narrowing the top-down figure to the same company size would pull the two closer. If they still disagree, trust the one whose inputs you can trace to named accounts.
Rule we use. Never present a single number without its method. State “bottom-up, 12,000 accounts at 14,000 USD” next to the total so a reader can challenge the input instead of the conclusion.
What mistakes break a TAM SAM SOM model?
These four show up most in the models we review for clients. They are our observations from reviewing models, not measured rates.
| Mistake | Symptom | Fix |
|---|---|---|
| Borrowing an analyst category size | TAM covers products and buyers you do not serve | Rebuild from your account definition |
| Skipping SAM | SOM jumps straight from TAM with no filter | List each real constraint and apply it |
| Setting SOM as a flat percentage | No link to reps, pipeline or win rate | Derive SOM from capacity |
| Never refreshing | Deck numbers match last year’s product | Recalculate each planning cycle |
The pattern behind all four is the same: a number was accepted because it looked reasonable, not because its inputs were traced. Rebuilding from account counts forces the trace.
How does this connect to the rest of go-to-market planning?
A sized SAM is the starting point for deciding which accounts get which treatment. Our guide to ABM segmentation tiers uses the same idea, and buyer persona versus ICP explains how to write the account definition in Step 1. Once SOM is set, demand generation planning turns it into a pipeline target.
Disclosure: MV3 Marketing sells market research and go-to-market planning, including this kind of sizing work. If you want a second pair of eyes on your own model, book a call with us.
FAQ
What is the difference between TAM, SAM and SOM?
TAM is total demand for the product category, SAM is the portion your reach and product can serve, and SOM is the share you can realistically win. Each one is a subset of the previous number.
Should I calculate TAM top-down or bottom-up?
Build bottom-up from counted accounts and contract value, then run a top-down figure as a check. If they disagree sharply, find which input defines a different customer set.
How is SOM different from a sales target?
SOM is a market ceiling you can plausibly reach given capacity and win rate, while a quota is the commitment you give a rep. A quota above SOM is a warning sign.
How often should I update the three numbers?
Recalculate each planning cycle and whenever contract value, product scope or sales capacity changes. A figure from a past fundraising deck rarely matches current pipeline reality.
Does the 12,000 account example apply to my business?
No. ExampleCo is fictional and every input is illustrative. Use the method and the code, and replace each number with your own counted data.
Share this article

Vance Moore is Chief Growth Officer at MV3 Marketing and leads its team of SEO professionals, engineers and auditors.
Ready to audit your organic growth opportunity?
$2,500 flat. 5 business days. Six deliverables tied to pipeline , not rankings. No retainer required.
Get the Organic Growth Audit →