What is funnel marketing and where does the model come from?
Funnel marketing is a way of organizing buyers by stage so each stage gets its own content, outreach and measurement. The stages usually run from awareness through consideration to a decision. The point is not the shape. The point is that each stage has its own count, so each hand-off has its own rate.
The model is older than software. Wikipedia’s entry on the purchase funnel says the association of the funnel model with the AIDA concept was first proposed in Bond Salesmanship by William W. Townsend in 1924. The same entry describes the purchase funnel as a consumer-focused marketing model. That matters for B2B SaaS, because a buying group is not one shopper, so the stages need to be counted at the account level.
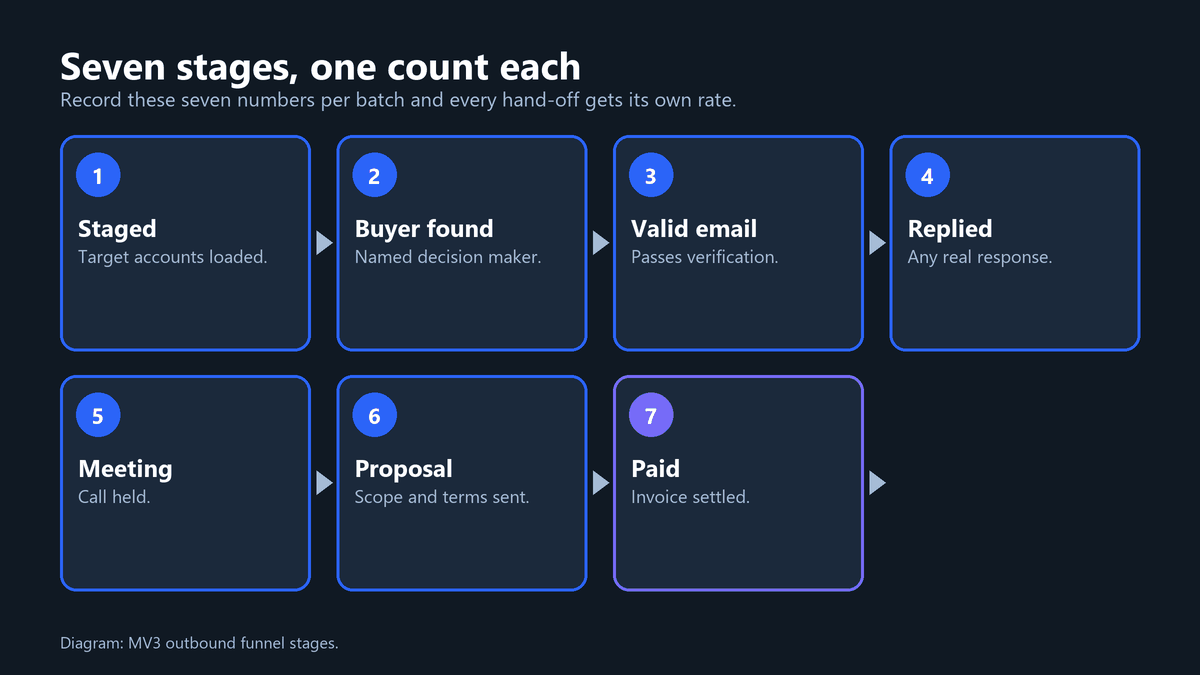
Definition we use. A funnel stage is a state an account can be in that you can count on a given date. If you cannot count it, it is a feeling, not a stage.
Why does one conversion rate hide the leak?
A single staged-to-paid number tells you that something leaked, but not where. Google describes its funnel exploration report as a way to “visualize the steps your users take to complete a task and quickly see how well they are succeeding or failing at each step” (Google Analytics Help, funnel exploration). Step-level visibility is the whole value of a funnel. A blended rate throws it away.
Stage rates also multiply. A weak rate early in the funnel caps everything after it, no matter how good your messaging is later. That is why the order of repair matters, and it is the main claim of this post.
What does our own funnel data show?
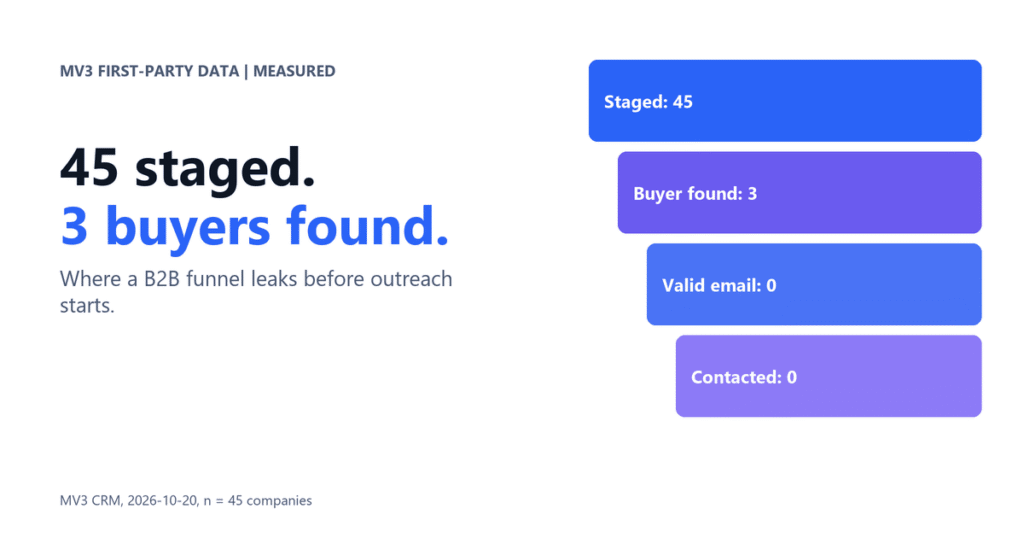
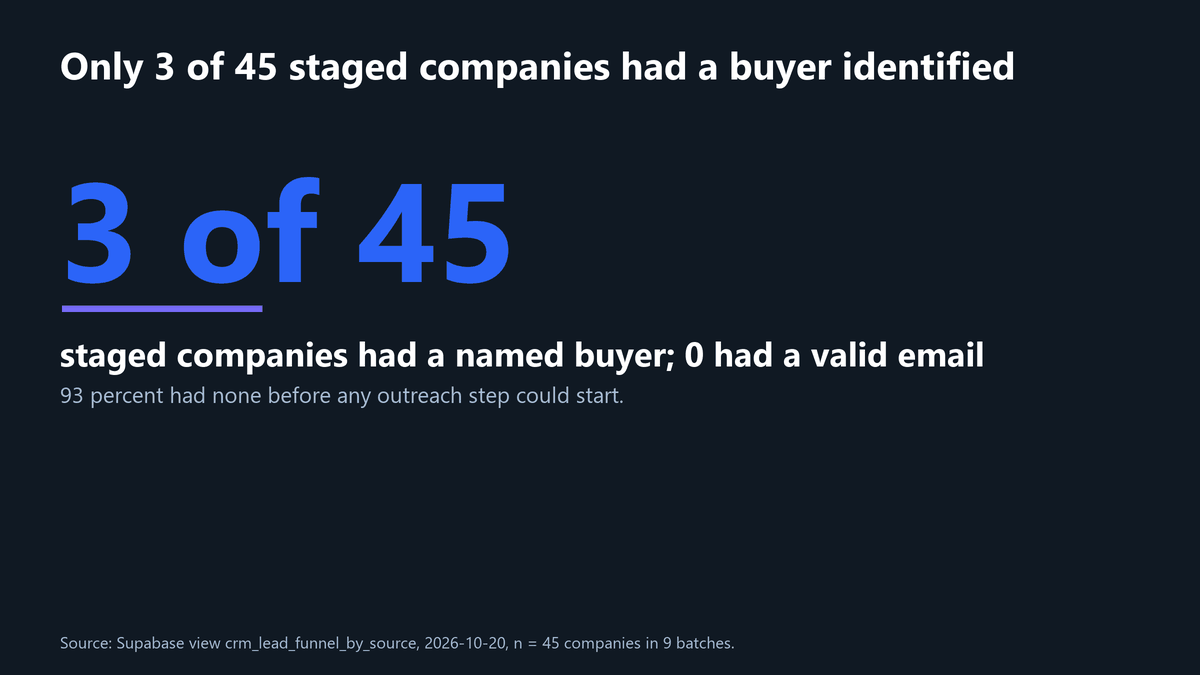
We checked our own outbound pipeline before writing this. On 2026-10-20 the crm_lead_funnel_by_source view held 9 sourcing batches with 45 companies staged in total. Only 3 of those 45 had a buyer identified, and all 3 came from a single batch of 10. None of the 45 had a valid email, and none had been contacted, replied, booked a meeting, received a proposal or paid.
That means 42 of 45 staged companies, 93 percent, had no named buyer before any outreach step could start. This is a small sample from our own early outbound build, not a benchmark for your team. It is also a measured example of a stage that content calendars rarely discuss: identification.
| Sourcing batch | Staged | Buyers found |
|---|---|---|
| Clay search, ICP v1 | 10 | 3 |
| Clay search, similarity v1 | 3 | 0 |
| CRM companies with no industry | 9 | 0 |
| CRM null-industry pool | 9 | 0 |
| CRM unscored batch | 5 | 0 |
| CRM plus web verification | 4 | 0 |
| CRM plus live data | 3 | 0 |
| CRM plus known entity | 1 | 0 |
| CRM live query | 1 | 0 |
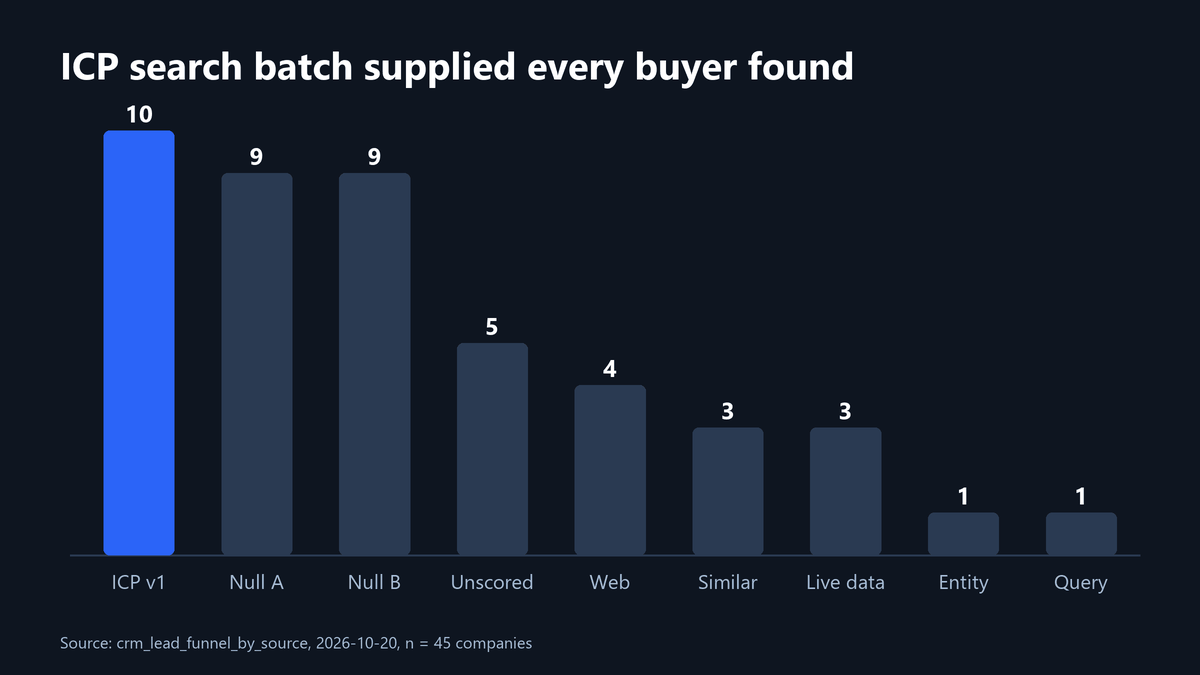
The pattern by batch is the useful part. The one batch built from a defined ideal customer profile search produced every buyer we found. Batches pulled from records with missing industry or scores produced none. We read that as a sourcing quality problem, which a better subject line would not have fixed. Treat it as a hypothesis from 45 rows, not a law.
How do you calculate stage-to-stage rates?
Pick one batch or one time window. Count the accounts in each stage. Divide each stage by the one before it. Do not divide by the top of the funnel, because that hides which hand-off failed.
Rule of thumb. Rate = this stage divided by the previous stage. Overall rate = last stage divided by first stage. Never mix the two.
The numbers below are ILLUSTRATIVE. They are a model we made up to show the arithmetic, not MV3 results and not a benchmark. Start with 1,000 staged accounts.
| Stage | Accounts | Rate from previous stage |
|---|---|---|
| Staged | 1,000 | not applicable |
| Buyer identified | 400 | 40% |
| Valid email | 240 | 60% |
| Replied | 24 | 10% |
| Meeting | 12 | 50% |
| Proposal | 6 | 50% |
| Paid | 2 | 33% |
You can compute the same view with a few lines of Python. We ran this snippet and the output below is its real output on the illustrative counts.
stages = [("Staged", 1000), ("Buyer identified", 400), ("Valid email", 240),
          ("Replied", 24), ("Meeting", 12), ("Proposal", 6), ("Paid", 2)]
for (a, na), (b, nb) in zip(stages, stages[1:]):
    print(f"{a} -> {b}: {nb}/{na} = {nb / na:.0%}")
print(f"Staged -> Paid: {stages[-1][1] / stages[0][1]:.1%}")
Staged -> Buyer identified: 400/1000 = 40% Buyer identified -> Valid email: 240/400 = 60% Valid email -> Replied: 24/240 = 10% Replied -> Meeting: 12/24 = 50% Meeting -> Proposal: 6/12 = 50% Proposal -> Paid: 2/6 = 33% Staged -> Paid: 0.2%
What this does: it prints each hand-off rate and the overall rate. Common error: dividing every stage by the 1,000 at the top, which makes every stage look equally bad.
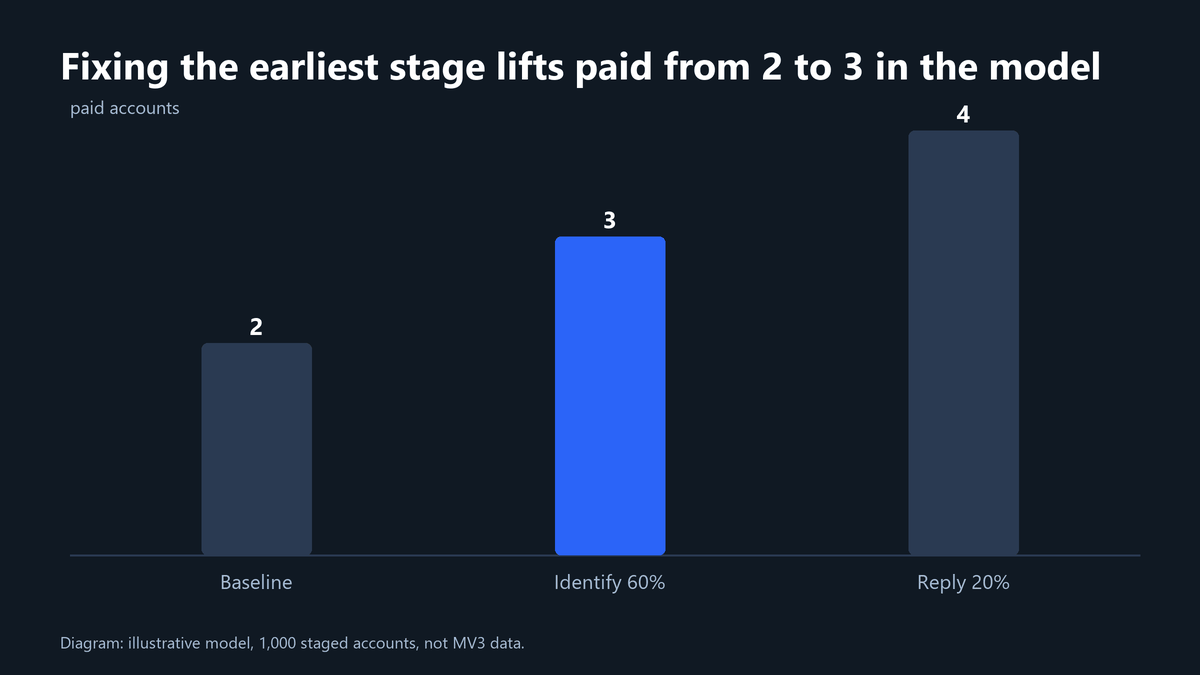
Now change one input. If identification rises from 40 percent to 60 percent and every later rate stays the same, the model gives 600, 360, 36, 18, 9 and 3 paid accounts. That is 3 paid instead of 2, a 50 percent lift from one stage. Doubling the reply rate from 10 percent to 20 percent instead gives 4 paid, so a reply fix is worth more here, but only if people exist to reply.
Which stage should you fix first?
Fix the earliest stage with a large drop that your team controls. Early stages cap everything downstream, and they usually have the biggest sample, so their rates are the most trustworthy. A late stage with a dramatic drop on six accounts is noise until you have more rows.
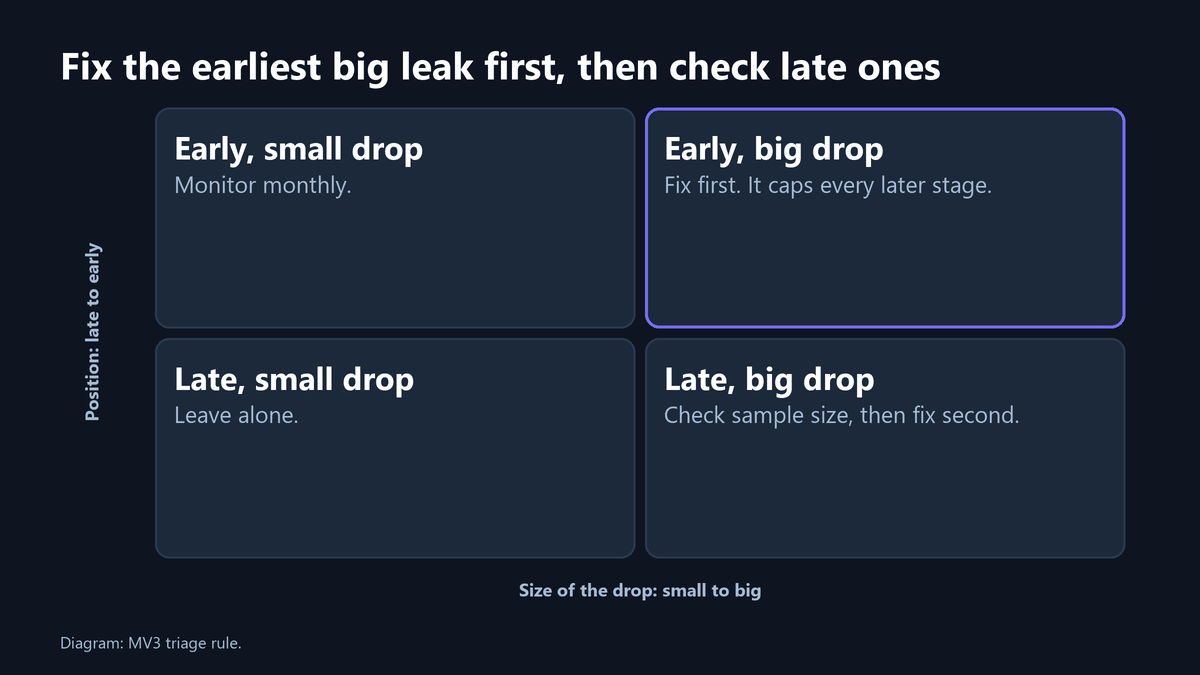
Check before you fix. Count the accounts at each stage before reading a rate. A rate built on fewer than a handful of accounts says almost nothing.
What do the pages that rank for funnel marketing look like?
We pulled the top five results for “funnel marketing” on 2026-10-12 with DataForSEO. Four returned complete data. Their lengths were 832, 3,081, 3,564 and 735 words, a median of about 1,957 words. Only one of the four carries FAQ schema and only one includes a data table.
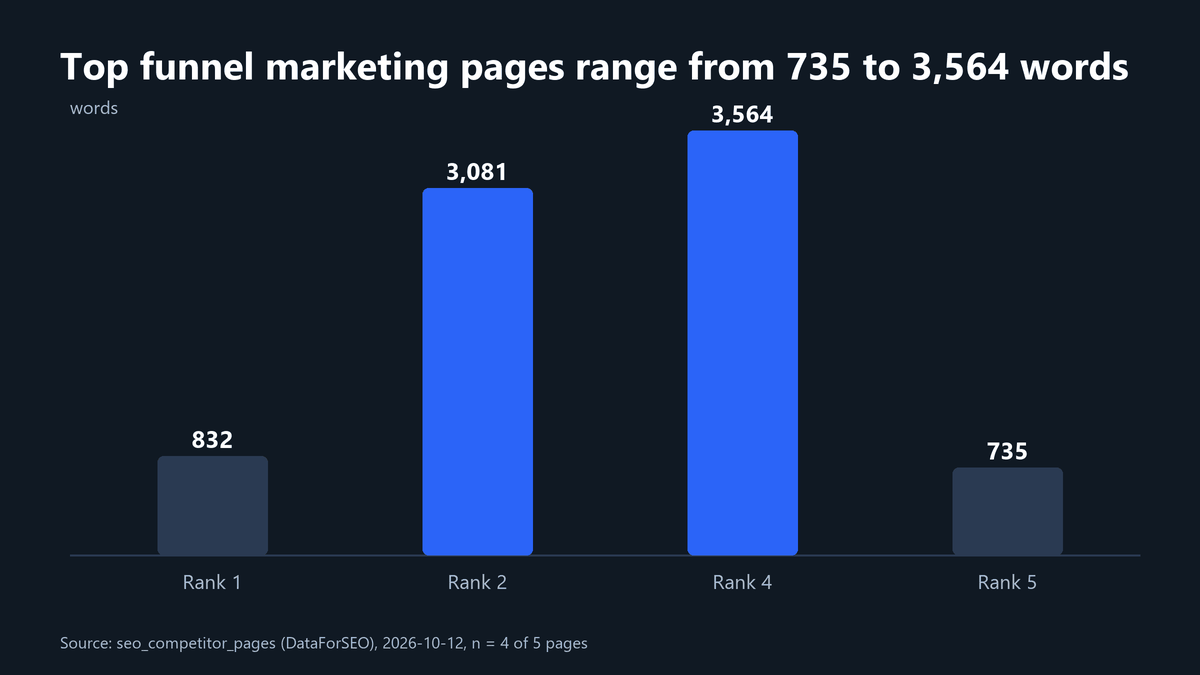
The shortest of the four has 45 images in 832 words, which tells us ranking pages lean on visuals, and it is one reason this post carries a chart or table in nearly every section. None of the five is a measured account of where a real funnel leaked, which is the angle we chose.
What goes wrong when teams read their funnel?
| Symptom | Likely cause | Fix |
|---|---|---|
| Everything after the top looks near zero | Earliest stage leaks, such as no buyer identified | Repair sourcing and enrichment before changing copy |
| A late stage looks terrible | Tiny sample at that stage | Wait for more accounts before acting |
| New batch looks worse than old batches | Newer batch has had less time to progress | Compare batches of the same age only |
| Rates differ wildly by source | Source quality, not messaging | Split the funnel by source and keep the best source |
Write the stage definitions down before you pull any numbers. Two people counting a meeting differently will produce two funnels from the same CRM. Agree on what counts as a reply, a meeting and a proposal, and keep the definitions fixed for as long as you compare batches. If a definition has to change, start a new series rather than splicing the old one.
Review stage counts weekly while you are still staging new batches, then monthly once a channel is stable. Keep each sourcing batch separate so an in-progress batch is never averaged with an old one.
How does MV3 use this, and what do we sell?
We sell outbound and analytics services, so we have a commercial interest in you counting your funnel well. Our outbound marketing service starts with the identification stage for exactly the reason above. To tie each stage back to revenue, read our marketing attribution guide. For the difference between creating and capturing demand, see demand generation versus lead generation. If you want to instrument the form stage in GA4, follow our GA4 key events guide, and for mapping content to the buying committee see our B2B content marketing strategy.
If you want a second set of eyes on your own stage counts, book a call with MV3 Marketing.
Checklist recap. Define each stage. Count accounts per stage for one batch. Divide each stage by the previous one. Check the sample size. Fix the earliest big leak. Recount next week.
FAQ
What is the difference between a sales funnel and a marketing funnel?
A marketing funnel usually starts at awareness. A sales funnel often starts once a named contact exists. The identification stage we measured sits at the hand-off between the two.
How many funnel stages should a B2B SaaS team track?
Track enough to see each hand-off clearly. We use seven for outbound. Too few stages hide the leak, and too many split small samples into noise.
Can funnel marketing work without paid advertising?
Yes. Our own example is an outbound funnel with no ad spend, and the stage-by-stage logic applies to inbound and outbound alike.
Should I compare my funnel rates with industry benchmarks?
Be careful. Benchmarks mix different motions, deal sizes and definitions of a stage. Compare your own batches over time first, and use outside numbers only when the source defines its stages the way you do.
Share this article

Vance Moore is Chief Growth Officer at MV3 Marketing and leads its team of SEO professionals, engineers and auditors.
Ready to audit your organic growth opportunity?
$2,500 flat. 5 business days. Six deliverables tied to pipeline , not rankings. No retainer required.
Get the Organic Growth Audit →